
Decode Markets,
Upgrade Your Game
Insights, trends, and expert strategies - All in one place


Events
m.Stock is going places with events pan India, building a community of m.Stock users along the way! Visit us, whenever we are in your town. Keep watching this space for more information.
-
TradeIQ Varanasi
TradeIQ is a power-packed trading seminar, designed to bridge the knowledge gap across all levels, from beginners to seasoned traders.
29th March 2026
Swatantrata Bhavan BHU Hindu University, Varanasi, Uttar Pradesh 221005"

-
TradeIQ Jaipur
TradeIQ is a power-packed trading seminar, designed to bridge the knowledge gap across all levels, from beginners to seasoned traders.
1st March 2026
Rajasthan International Center, Bhamashah State Data Centre Block-C, Jaipur, Rajasthan 302017.


F&O Strike
Challenge
F&O Strike
Challenge
Test Your Trading Skills
Answer 5 quick questions on F&O, equity and more. Score 4 or higher and you could win exciting vouchers at our booth.
Enter your details
We’ll use these details to validate your reward at the booth.
Podcast
View All
0 Views
Gaurav Mishra
Co-Head Equity, Mirae Asset Mutual Fund
Affordable Housing Surge - What's Fueling the Growth?
0 Views
Manish Sheth
MD & CEO of JM Financial Home Loans
Women in Finance & Leadership: A Conversation with Swati Khemani
0 Views

Swati Khemani
Founder and CEO of Carnelian Asset Management and Advisors

Articles
View All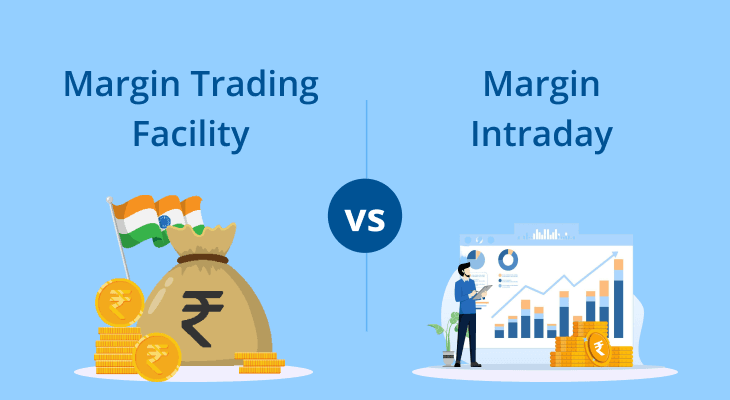
Pay Later (MTF) vs margin intraday – pros & cons
April 1, 2026 | 9 mins read
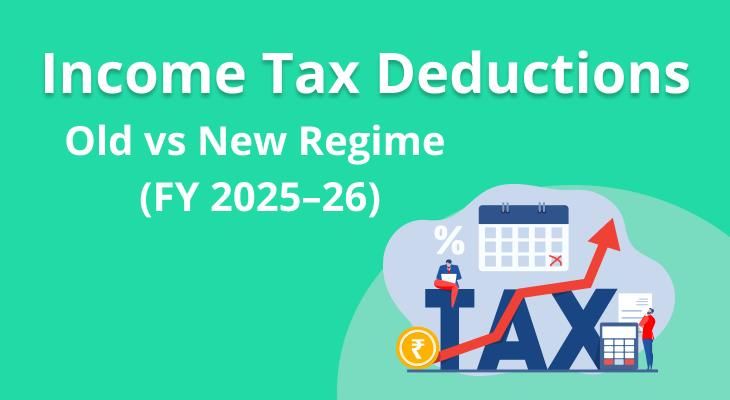
All you need to know about types of income tax deductions in new regime & old regime in FY 2025–26
April 1, 2026 | 6 mins read
Vivid Electromech Ltd
IPO Day 4 Subscription Status

Vivid Electromech Ltd IPO Day 4 Subscription Status
March 30, 2026 | 3 mins read
Sai Parenteral's Ltd
IPO Day 4 Subscription Status
Sai Parenteral's Ltd IPO Day 4 Subscription Status
March 27, 2026 | 3 mins read