How to Read a Profit & Loss Account
- What is a Profit & Loss (P&L) statement?
- Where to find a company’s P&L statement
- How to analyse a P&L account effectively
- Key P&L ratios to monitor
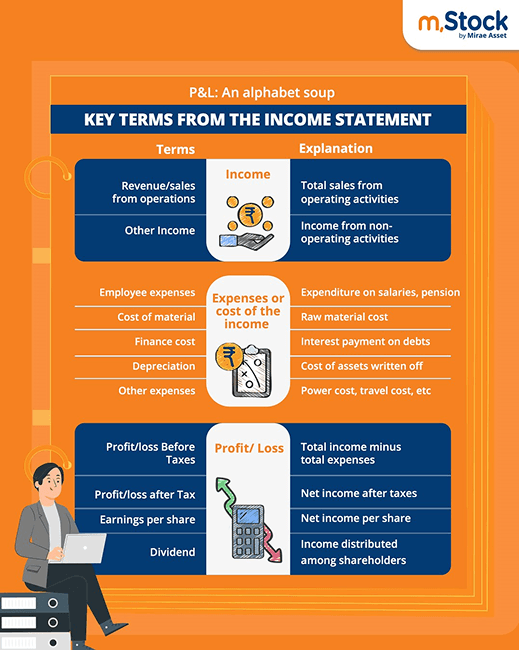
The Profit and Loss statement is one of the most essential parts of a company's financial reporting. It captures the financial outcome of the company's core operations over a specific period—typically a fiscal year. For shareholders, this document is critical as it reflects the financial health of the business and the management’s capability to generate value and sustain operations.
Points to Focus On
When analysing a P&L statement, here are the main areas to keep in mind:
Comparison with peers and past performance
Key ratios and financial indicators
Explaining significant variations
Identifying historical trends
Projecting future performance
To illustrate, consider P&L statements of companies from different sectors. You'll notice that revenue and expenditure categories can vary significantly depending on the industry.

For example, banks earn primarily through interest income, while a manufacturing company’s revenue stems from product sales. The structure of expenses differs as well—banks incur higher interest costs, whereas manufacturers spend heavily on raw materials and production.
Hence, comparing the P&L of one company with another across industries isn’t meaningful. For a valid comparison, businesses must belong to the same sector.

How to Assess a P&L Statement
Detailed Analysis
Thorough analysis involves multiple angles:
Historical comparisons: Look beyond one or two years. Analyze 5–10 years of data to identify meaningful trends.
Peer benchmarking: Evaluate the company's performance against competitors in the same industry.
Supporting documents: Always read the P&L along with the director’s report, management discussions, auditor’s report, and notes to accounts for a comprehensive understanding.
Analyzing Sales
One of the first indicators to examine is sales:
Track value and volume growth separately. Volume growth signals increased market reach, while value growth reflects pricing power or product mix changes.
Review unit realization to see if the company is earning more or less per unit sold.
Adjust past sales numbers for inflation to gauge real performance, not just nominal growth.
Focus on Margins
Margins are key profitability indicators and must be monitored closely:
Check if margins are expanding or shrinking year-over-year.
Identify what’s driving these changes—be it input costs, pricing, or operational efficiencies.
You'll often find margin explanations in the management discussion section or transcripts from earnings calls.
Evaluating Expenses
Not all expense increases are red flags, but unusual spikes warrant a closer look:
For instance, if employee costs have surged, it might be due to a voluntary retirement scheme (VRS) or a new wage agreement.
Determine whether such expenses are recurring or one-time events, as that greatly affects the interpretation of the bottom line.
Key Takeaways
The Profit & Loss account is vital for understanding operational efficiency and overall business performance.
Industry context is crucial—don't compare companies from unrelated sectors.
An in-depth review of trends, ratios, and explanatory notes leads to better investment decisions.
Always read the P&L in conjunction with other financial statements and management commentary to get the full picture.