What is Technical Analysis?
- Understand what technical analysis means in stock markets
- Explore the benefits of using technical analysis
- Learn how to access and interpret charts and price data
- Get familiar with different chart types and their significance
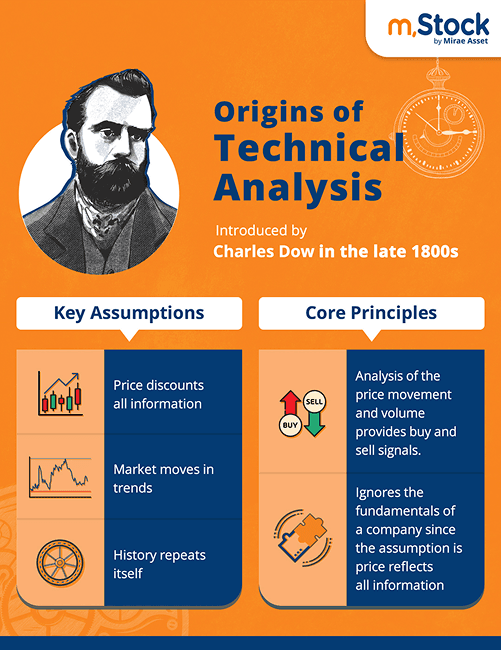
Understanding Technical Analysis
Technical analysis is a method used by investors and traders to identify potential trading and investment opportunities by examining a stock’s historical price trends and chart patterns. This approach revolves around interpreting stock price charts, which graphically represent price and volume data over various timeframes.
While fundamental analysis dives into a company’s financials, technical analysis focuses purely on market behavior and sentiment reflected in price movements. The beauty of this method is its accessibility it requires no background in accounting or finance, just a keen interest in understanding stock patterns.
Benefits of Technical Analysis
Inclusive for All Backgrounds: Regardless of your academic stream — be it Arts, Science, or Commerce — anyone can master technical analysis with dedication and practice.
Pinpoint Entry & Exit: Technical indicators help you determine the right time to buy or sell a stock, adding value even to those who primarily rely on fundamental research.
Ideal for Short-Term Traders: For intraday and short-term strategies, technical analysis is far more practical than fundamental analysis. It helps identify patterns, breakouts, and trade signals with precision.
Time-Tested Assumptions: Based on the principle that "the market discounts everything," technical analysis reflects all known information in stock prices, making it a powerful and timely tool.
Limitations of Technical Analysis
Not Foolproof: Historical trends can offer clues but don’t always guarantee future performance, sometimes leading to incorrect forecasts.
Conflicting Indicators: With numerous tools and indicators available, traders may often encounter mixed signals, causing confusion or misjudgment.
Inapplicable to IPOs: Technical analysis doesn’t apply to newly listed stocks with no historical data, where fundamental analysis is the only route.
Accessing Charts and Price Data
Gone are the days of relying on daily Bhav copies. Today, real-time price updates and interactive charts are readily accessible via online platforms.
You can obtain historical price data from official exchange websites like:
Bombay Stock Exchange: https://charting.bseindia.com/
National Stock Exchange: www.nseindia.com
Most brokerage platforms including m.Stock also provide integrated charting tools. These platforms let you visualize price patterns, apply technical indicators, and simulate trades. Beginners are encouraged to start with paper trading to build confidence before executing real trades.

Chart Types and Their Meaning
There are three major types of charts used in technical analysis:
Line Charts
Plot only the closing prices of a stock over time
Useful for quick, high-level trend spotting
Bar Charts
Display the opening, closing, high, and low prices for each time interval
Vertical lines represent the high-low range, with horizontal ticks on either side for open (left) and close (right)
Candlestick Charts
Most widely used due to their detailed visual representation
Each candle represents price action for a specific period, with color-coding (typically red for down, green for up)
Wicks show intraday highs and lows, while the body reflects the opening and closing prices

These charts present price on the Y-axis and time on the X-axis. While line charts offer simplicity, bar and candlestick charts provide more depth in analyzing market behavior and volatility.
For instance:
A red candle signals a price decline (close < open), while a green candle indicates an upward move (close > open).
A long upper wick may indicate selling pressure near the day’s high.
A long lower wick could suggest a rebound from intraday lows.
Absence of wicks may imply strong closing trends near the high or low of the session.

Final Thoughts
The rise of online trading platforms and the availability of sophisticated charting tools have significantly boosted the popularity and effectiveness of technical analysis. Whether you’re a novice investor or a seasoned trader, understanding technical charts can empower you to make smarter, more informed decisions in the stock market.