Fibonacci Retracement: A Mathematical Perspective to Stock Trading
- Understanding Fibonacci retracement and its role in technical analysis
- How to use Fibonacci retracement to determine price targets and stop losses
- The concept of the Golden Ratio and its application in stock charts
What’s common between a lily, a buttercup, and a daisy? Besides being different types of flowers, there's a fascinating pattern hidden in their petals—the number of petals on each aligns with Fibonacci numbers! Lilies have three, buttercups have five, and daisies can have 21 petals, all part of the Fibonacci sequence. Nature is full of such examples.
Named after the mathematician Fibonacci, this number sequence is believed to be more of a discovery of a naturally occurring order than a mere invention. Here's how the Fibonacci sequence looks:
0, 1, 1, 2, 3, 5, 8, 13, 21, 34, 55, 89, 144...
Each number is derived by adding the two preceding ones. For example:
8 = 3 + 5
55 = 21 + 34
This unique sequence forms the foundation for several theories in mathematics, art, architecture, and even trading.
How Fibonacci Numbers Connect to Stock Prices
On their own, Fibonacci numbers may seem irrelevant to financial markets. But when these numbers are used to derive ratios, they become powerful tools in technical analysis. One such ratio is the Golden Ratio, also known as Phi.
By dividing a Fibonacci number by its preceding number, you get a value that approaches 1.618, the Golden Ratio. For example:
55 ÷ 34 ≈ 1.618
34 ÷ 55 ≈ 0.618
34 ÷ 89 ≈ 0.382
34 ÷ 144 ≈ 0.236
When converted into percentages—61.8%, 38.2%, and 23.6%—these figures become essential retracement levels used in stock price analysis. Along with 50%, which is psychologically significant (though not a Fibonacci number), these are collectively known as Fibonacci Retracement Levels.
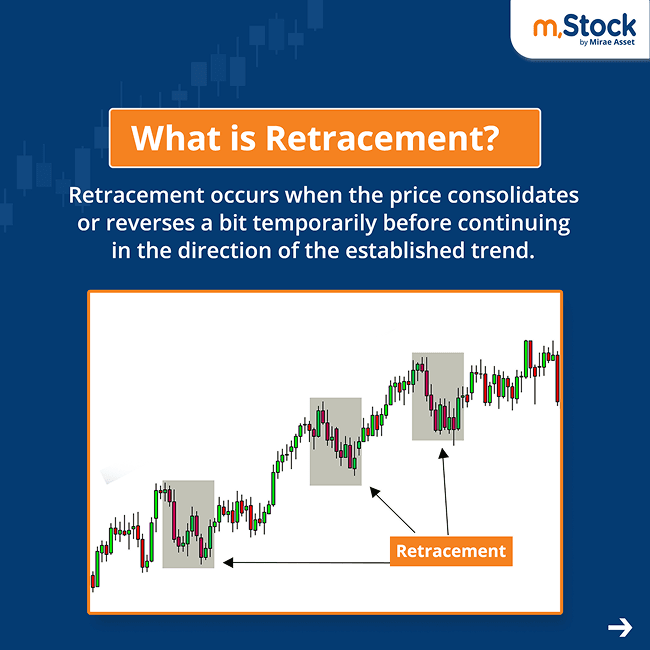
Applying Fibonacci Retracement in Stock Charts
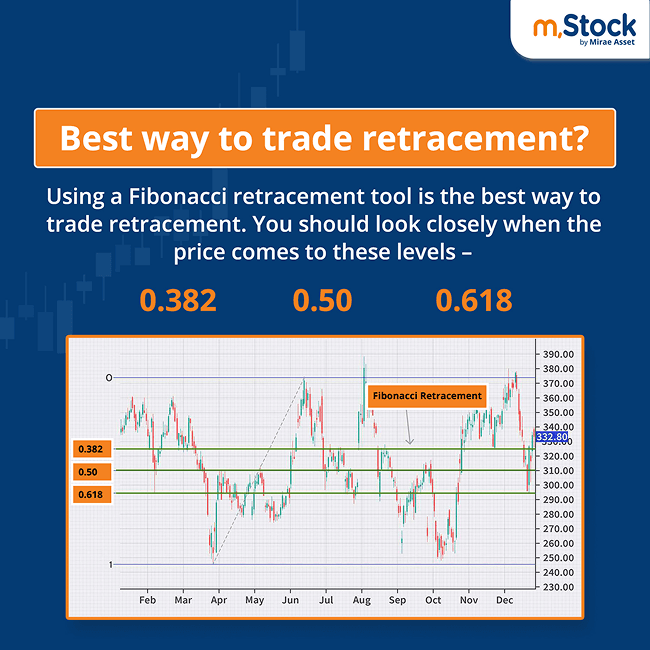
Most trading platforms, including m.Stock, offer tools to draw Fibonacci retracement levels on charts. These tools help traders predict where a stock or index might find support during a price correction.
The process involves identifying the range of a recent uptrend, from the lowest point (the base) to the highest point (the peak). After selecting the Fibonacci retracement tool, you draw a line from the start of the rally to its end point. The tool then automatically generates retracement levels such as 23.6%, 38.2%, 50%, and 61.8%.
Real-World Example: Nifty 50 Chart Analysis
On a Nifty 50 chart, let’s assume:
Point A marks the beginning of an uptrend.
Point B is the peak of that move.
Using Fibonacci retracement:
The index first paused around the 23.6% level, consolidating briefly.
It later found support at the 61.8% level, which triggered a short-term bounce.
The 38.2% level turned into resistance, pushing prices lower again.
Eventually, 78.6% (a lesser known, but often used level) acted as strong support, reversing the downtrend.
Do note, prices may not reverse exactly at these levels. They often act as zones of support or resistance. Therefore, traders should always pair Fibonacci analysis with other technical indicators to confirm market signals.
Points to Remember
The Fibonacci sequence is based on the sum of the two preceding numbers.
Ratios like 0.618, 0.382, and 0.236 (or 61.8%, 38.2%, and 23.6%) are key retracement levels.
To use this tool effectively, it’s crucial to accurately identify the lowest and highest points of a price movement.
These levels serve as potential support and resistance zones, not guarantees.
Always combine Fibonacci retracement with other technical tools to strengthen your trading decisions.