Reversal Patterns: Understanding Trend Reversals in Stock Markets
- What are reversal patterns?
- What are the types of reversal patterns?
- What do reversal patterns indicate?
- How does one trade continuation patterns?
Every market trend eventually reaches a turning point. In the world of trading and investing, understanding when a trend is losing momentum is crucial. Trends, whether bullish or bearish, do not last forever. At some point, they pause, consolidate, and reverse. This is where reversal patterns come into play.
A reversal pattern signifies the potential end of an existing trend and the beginning of a new one in the opposite direction. These formations on a price chart help traders anticipate when the current upward or downward movement might reverse. The longer these patterns take to form, the stronger the potential price movement following the breakout.
Key Reversal Chart Patterns Explained
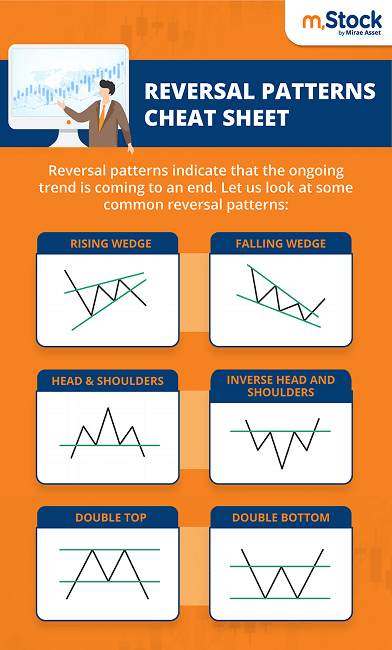
1. Wedges and Their Reversal Indications
Wedges are chart patterns formed by two converging trendlines. Unlike pennants, wedges move in the same direction and can signal both bullish and bearish reversals depending on their structure.
Rising Wedge – Bearish Reversal
A rising wedge pattern forms when two upward-sloping trendlines converge. The support line is typically steeper than the resistance line. As price movement narrows, a breakdown through the support line often follows, indicating a bearish trend reversal.
Tip: Do not confuse rising wedges with ascending triangles. While both feature rising prices, the ascending triangle has a horizontal resistance line, unlike the gradually weakening demand in a rising wedge.
Validation: The price must test the support at least three times and resistance twice. Once the support breaks, the pattern is confirmed. The expected price move is equal to the height of the wedge's base.
Falling Wedge – Bullish Reversal
In this setup, two downward-sloping trendlines converge. It reflects weakening selling pressure, suggesting a potential breakout on the upside.
Validation: Like the rising wedge, a falling wedge requires multiple touches on both trendlines. Once the resistance is breached, the pattern confirms. The potential price target mirrors the wedge’s base height.
2. Triangles: Flat Levels Meet Dynamic Trends
Ascending Triangle vs. Rising Wedge
An ascending triangle features a flat resistance line and a rising support line. When the resistance is eventually broken, it signals a strong upward movement. Unlike this, the rising wedge lacks a consistent resistance level and signals weakening bullish momentum.
Descending Triangle vs. Falling Wedge
A descending triangle has a flat support line and a falling resistance line. A breakdown below the support suggests a strong bearish move. Meanwhile, a falling wedge is more gradual and often hints at a bullish reversal instead.
3. Head & Shoulders – The Classic Reversal Blueprint
Head & Shoulders – Bearish Reversal
This well-known pattern resembles a head with two shoulders. Here's how it unfolds:
Left Shoulder: Price rises with volume, then dips.
Head: A higher peak forms with strong volume, followed by another dip.
Right Shoulder: A lower peak than the head with weaker volume forms.
Neckline Break: When the price falls below the neckline (formed by the dips), the pattern confirms a reversal.
Volume plays a critical role in validating this pattern.
Target: Measure the distance from the neckline to the top of the head and subtract that from the neckline.
Inverse Head & Shoulders – Bullish Reversal
This is the mirror image and signifies a potential trend reversal from bearish to bullish.
Left Shoulder: A sharp decline with volume, followed by a pullback.
Head: A lower low forms, followed by another bounce.
Right Shoulder: A smaller decline, followed by an upward breakout through the neckline.
Breakout above the neckline confirms the reversal, with the target calculated similarly as the head-to-neckline distance.
4. Double Top and Double Bottom – Trend Shift Indicators
Double Top – Bearish Reversal
Prices rally to a resistance level twice and fail to break through both times. After forming two peaks, the price drops below the neckline, confirming the pattern.
Target: The vertical distance between the top and the neckline.
Tip: Always set a stop loss, as false breakouts are possible.
Double Bottom – Bullish Reversal
This is the opposite of the double top. Prices dip twice to a similar level and rebound both times. When the price breaks above the neckline after the second dip, the pattern confirms.
Target: Height between the bottom and the neckline.
Tip: This pattern indicates that selling pressure is waning and buyers are gaining momentum.
5. Rare Formations – Triple Tops and Bottoms
While triple tops and triple bottoms can occur, they are far less common. These patterns follow similar logic as double formations but with three price tests at the top or bottom levels, strengthening the reversal signal.
Conclusion: Putting Pattern Recognition into Practice
Understanding chart patterns like reversal formations helps traders navigate volatile markets with confidence. These patterns often repeat over time, offering a reliable framework for anticipating trend shifts. However, it’s crucial to practice identifying them in real-time and combine them with other technical indicators for accuracy.
Not every pattern plays out as expected—external market forces, news, or macroeconomic changes can override technical signals. Always use risk management tools like stop-losses, and most importantly, test your skills before trading live.