Time Cycles
- What are time cycles and why they matter in trading
- Understanding the phases of stock market cycles
Cycles are recurring patterns that unfold over consistent time intervals. These cycles exist in many areas of life (from changing weather patterns to economic conditions) and the financial markets are no exception.
Just as the natural world follows the rhythm of spring, summer, autumn, and winter, the markets, too, operate in phases. According to cycle theory, price movements follow these recurring patterns driven by underlying forces. These forces cause the market to rise, peak, decline, and eventually bottom out, only to start a new cycle again.
Technical analysts often use both time and price cycles to estimate the cycle duration, identify cycle lows, and anticipate market turning points. However, while market cycles are real, they are not always consistent. At times, they shift or even disappear temporarily, making it difficult for traders to time the market perfectly.
Phases of Cycles in the Stock Market
Market cycles are broadly divided into four key phases:
Accumulation Phase
Mark-up Phase
Distribution Phase
Mark-down Phase
Let’s explore each phase in detail.
Accumulation Phase
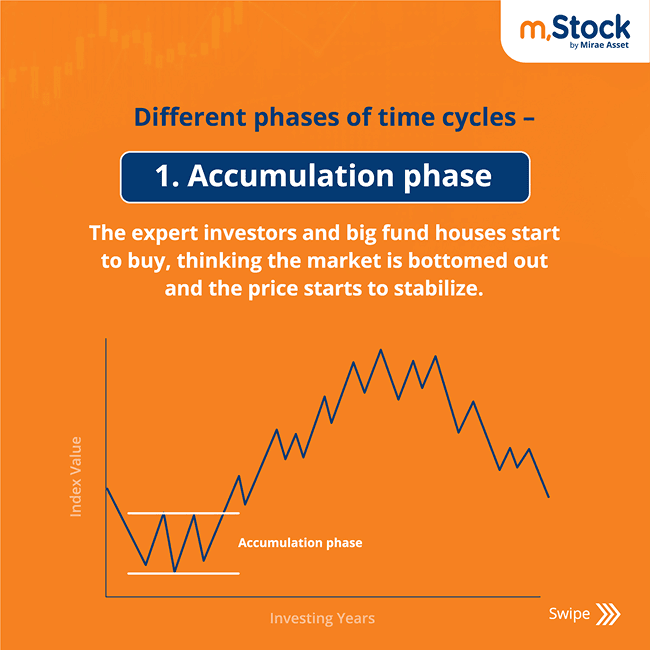
This phase represents the market bottom. After a prolonged downtrend, prices start to stabilize, and experienced investors begin looking for value opportunities. Although broader sentiment remains bearish, prices are available at significant discounts.
Most investors are still cautious during this time, and some even exit the market after enduring long periods of losses. However, patient and strategic investors begin building positions quietly, expecting the worst to be over.
Market activity stays low, and price movement is generally flat. As time passes, sentiment shifts from negative to neutral, setting the stage for the next leg of the cycle.
Mark-up Phase
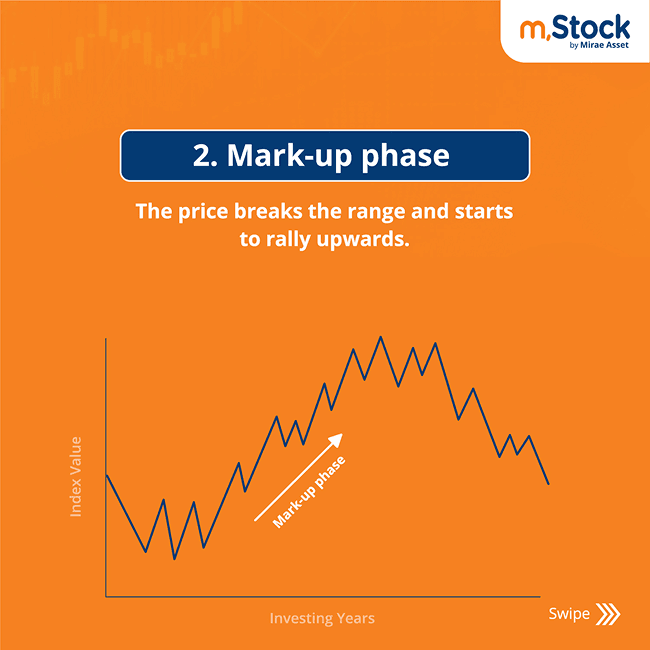
As the market begins to show signs of recovery, prices start forming higher highs and higher lows. Technical analysts pick up on trend reversals and move in early, often ahead of the crowd.
This phase gathers momentum as more investors notice the recovery. Fear of Missing Out (FOMO) kicks in and buying accelerates. Eventually, greed begins to take over, and prices shoot up, sometimes beyond reasonable valuations.
During the final stretch of this phase, latecomers rush in, chasing fast gains. This is also when seasoned investors start exiting, locking in profits. A brief dip in prices often triggers renewed buying, leading to a selling climax where the fastest gains occur just before the peak.
Distribution Phase
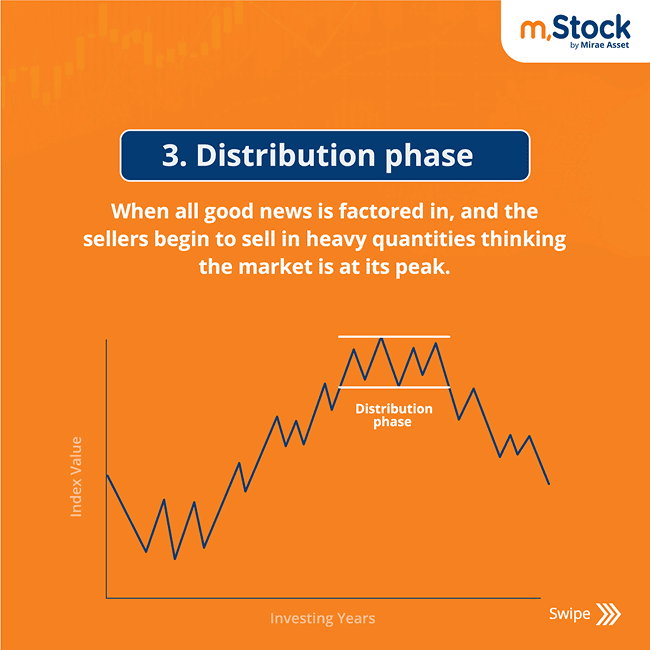
At this point, the market is in a state of equilibrium, where both buyers and sellers are active. Prices move within a range as bulls and bears battle it out.
Sentiment is mixed. News events, especially global economic developments or geopolitical shifts, can quickly disrupt the balance and trigger volatility. Traders often misread this sideways movement as a pause before the next rally, but it usually signals that the uptrend is losing steam.
Mark-down Phase
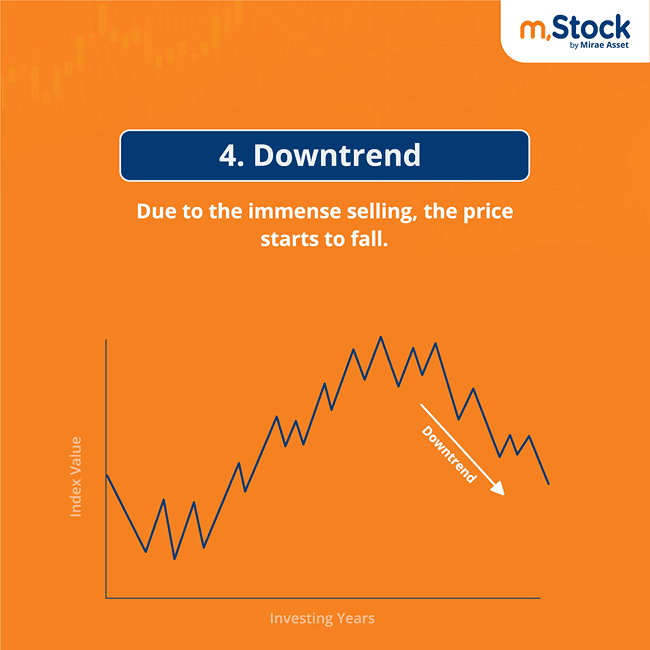
This is the decline stage of the market cycle. Investors who bought near the top now watch prices drop below their purchase levels. Hoping for a turnaround, they hold on too long, only to be forced out with heavy losses.
As panic sets in, selling intensifies. Meanwhile, technical experts begin recognising the signs of a market bottom. Smart money starts building new positions again, initiating the beginning of a fresh accumulation phase.
Unfortunately, less experienced investors often fall into the same trap by buying during the early accumulation phase, believing it's a bounce, only to be caught in another leg down.
Presidential Cycle
One of the lesser known yet impactful cycles is the Presidential Cycle, which affects a wide range of asset classes including equities, real estate, commodities, and bonds.
This four-year cycle is based on the political timeline of a presidential term in the United States. The first two years often involve economic adjustments or tough decisions. As elections near, administrations typically ramp up efforts to boost economic performance, hoping to generate positive public sentiment and secure re-election.
These cyclical shifts can influence investor confidence and market trends, making it an important factor in long-term market forecasting.
Gann Cycle
Developed in the early 1900s by W.D. Gann, this method blends time and price analysis with geometry and natural laws.
Gann believed that market behaviour followed geometric proportions (circles, squares, and triangles) and that these could be used to predict turning points with high accuracy. His techniques offer insights into not just the direction of market movement, but also ideal entry and exit points.
Also Read: https://www.mstock.com/investment-glossary
Points to Remember
Market cycles are recurring, but their timing and patterns can vary widely.
They don't always follow a predictable timeline and may pause or disappear temporarily.
Picking the exact top or bottom of a cycle is nearly impossible, even for experienced traders.
Despite uncertainties, understanding market phases provides an edge in investment planning.
Time cycles, when used in conjunction with other tools, can significantly improve decision-making.