Volume & Volume Profile in Trading
- What is volume profile in technical analysis?
- How to use volume profile for smarter trading decisions
- The influence of volume and volume profile on market behavior
- Integrating volume analysis into your trading strategy
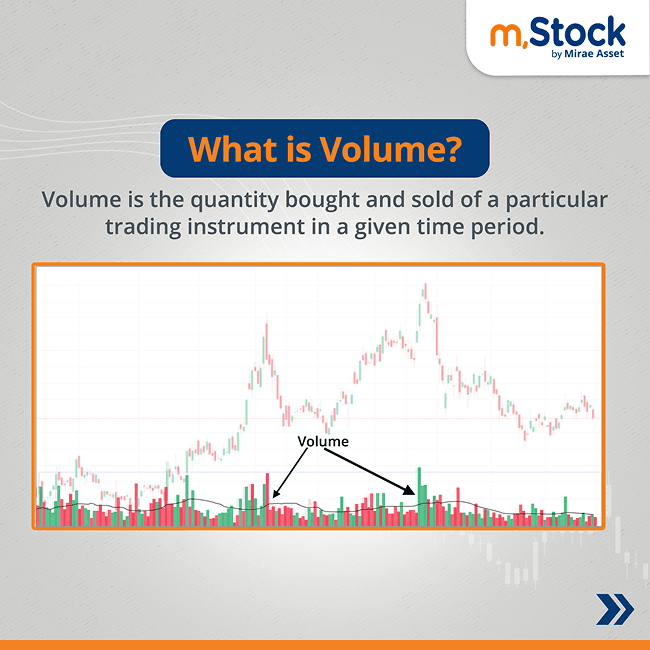
Understanding Volume in Stock Trading
In the financial markets, prices are dictated by a fundamental law of economics—supply and demand. When demand exceeds supply, prices climb. When supply outweighs demand, prices fall. This principle is just as valid in stock trading, where price changes must always be evaluated alongside volume, the actual number of shares exchanged in a session.
Volume reflects the market's conviction behind a price move. If a stock rises with increasing volume, it suggests strong buying interest. Conversely, if it falls with high volume, sellers are in control. If prices move but volume is weak, the move may lack strength or sustainability.
Volume data is typically visualized at the bottom of a price chart through vertical bars. Green bars represent up-volume (price closed higher than previous day), while red bars show down-volume (price closed lower). These bars mirror the colour of the corresponding candlesticks in the chart, providing instant visual cues for trend analysis.

Volume in Index Trading and Derivatives
For indices like Nifty 50, volume in the traditional sense doesn’t exist in the spot market as no direct buying or selling occurs. Instead, derivative data such as futures and options contracts act as a proxy. Here, the concept of Open Interest (OI) becomes crucial. It indicates the number of unsettled contracts and gives insight into market sentiment. An increase in OI reflects rising interest in that position, while a decrease suggests unwinding of trades.
Why Liquidity Matters
Liquidity plays a critical role in the ease of entering and exiting trades, especially for institutional investors. A highly liquid stock allows for transactions with minimal price disruption. Conversely, in a less liquid stock, large orders can trigger sharp price movements, potentially working against the trader’s interest.
Volume as a Tool in Technical Analysis
Volume is a powerful companion to price action and is frequently used by technical analysts for confirmation or warning signals.
Trend Continuation
If an uptrend is accompanied by rising volume, it signals growing interest and the likelihood of the trend continuing. Similarly, a downtrend supported by increasing volume indicates strong bearish sentiment and potential for further decline.
Trend Reversal Indicators
When price movement begins to diverge from volume, it's often an early sign of a trend reversal. A rising or falling stock with declining volume signals weakening interest, possibly leading to a sideways trend or full reversal.
An ideal pullback during an uptrend is typically marked by lower volume, which implies temporary weakness and not a permanent trend change. On the flip side, sharp price moves on unusually high volume may suggest a peak or exhaustion, indicating the trend may soon reverse.
Note: Volume by itself may not provide a full picture. It should always be used in conjunction with price patterns and other technical indicators for informed decision-making.
Volume Profile: A Trader’s Precision Tool
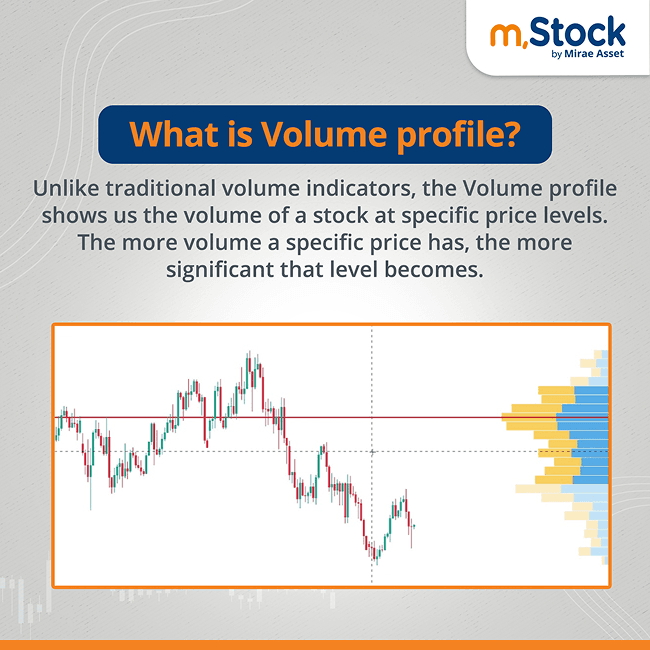
Unlike standard volume bars that measure trading activity over time, the Volume Profile tool shows how much trading occurred at specific price levels within a chosen time frame. It gives a more detailed view of market interest zones, helping traders pinpoint entry and exit points with greater confidence.
This tool is sometimes referred to as horizontal volume, as the volume histogram runs horizontally across the chart. The longest horizontal bar is known as the Point of Control (POC, the price level at which the highest volume was traded. This level often acts as a key support or resistance zone.

Volume Profile is especially valuable because it reflects the price levels where institutional and retail traders were most active. This makes it easier to identify strongholds and vulnerabilities in the market structure.
While the Volume Profile is a powerful indicator, it should not be used in isolation. For accurate insights, combine it with trend analysis, candlestick patterns, and other technical tools.
Illustrated Example Shown below is the Volume Profile of Reliance Industries on a daily chart. The POC highlights the price with the highest volume traded, helping traders make decisions on stop-loss placement, potential breakout zones, or trend reversals.
Points to Remember
Volume shows how many shares were traded, acting as a confirmation tool for price trends.
Volume analysis can reveal liquidity, trend strength, and potential reversals.
Pullbacks with low volume usually indicate that the dominant trend is intact.
Volume Profile focuses on price-based volume distribution, offering insights that time-based volume does not.
Use Volume Profile and volume data as supporting tools, not in isolation, for accurate trading decisions.