
July 25, 2024 | 5 min read
Understanding the 3 Essential Phases of Trade Analysis
Trading in the financial markets is a skill that takes time to master. Many traders believe that trading simply involves the purchase and sale of securities. However, that’s far from the actual truth. As a matter of fact, in-depth research and analysis also forms a major part of financial market trading.
This is precisely why experienced traders often dedicate time and effort towards trade analysis. By analyzing their trades before and after they’re executed, traders can gain crucial insights that they can use to formulate well-informed decisions in the future. Wondering what trade analysis is? Here’s everything you need to know about this unique concept.
What is Trade Analysis?
Trade analysis, also known as trading analysis, is the process through which traders examine and evaluate the various aspects and parameters of a particular trade. The primary objective of such a process is to provide traders with crucial and relevant information that can help them make better trading decisions in the future.
What are the different phases of Trade Analysis?
Now that you have an idea of what trading analysis is, let’s look at its various phases. The process can be classified into three different phases - research and analysis, trade execution and trade review. As an investor, you need to have a thorough understanding of these three phases.
Research And Analysis
The first phase of trade analysis involves preparing for the trade through proper research and analysis. To gain useful insights, you need to thoroughly look into the specifics of the security you wish to trade using fundamental analysis techniques.
For instance, if you wish to trade in a stock, consider looking into the company’s financial statements and comparing the various financial ratios with that of its peers and the industry average. This should give you an idea of where the company currently stands.
Fundamental analysis is just one part of this phase. To ensure that you do the best analysis for trading in a security, you need to also focus on technical analysis. Technical analysis involves examining historical price and volume data to predict future movements.
A combination of both fundamental and technical analysis techniques should give you enough information to make an informed trading decision.Trade Execution
The second phase of trading market analysis is trade execution. This phase involves placing buy and sell orders based on your view of how the market is likely to respond. Now, before you execute your trade, it is important to consider certain factors. The factors include the highs and lows for the day, real-time bid-ask spreads and trading volume. Reviewing this information before you place a trade can help you establish the right entry and exit points including stop-losses.Trade Review
Trading analysis doesn’t end with the execution of your trade. In fact, it extends far beyond it. Often experienced traders continue to do research long after their trades are executed. Such detailed introspection into a trade can help you identify mistakes and serve as a huge learning opportunity. Even if the trades are successful, you can often get critical information on what made the trade a success and use the knowledge to improve future trading performance.
How to successfully implement the trade review phase of Trade Analysis?
Despite its importance, the trade review phase of trade analysis is often overlooked because many traders lack the knowledge necessary to implement it. Here’s a step-by-step guide that you can use to execute the third phase of trade analysis successfully.
Collate Trade Details
Collating all trade-related information in a spreadsheet can make the trade review exercise a lot easier. Note down critical information such as the date of the transaction, details of the security, traded quantity and price. Using the tools in a spreadsheet program, calculate the profit or loss from each trade in both absolute numbers and percentages.Use The Price And Volume Charts
Once you’ve collated all the relevant trade-related information, the next step is to download the price and volume charts for the particular asset. There are many online tools that allow you to download these charts for free. Once you have access to these charts, proceed to plot the various entry and exit points on the charts along with other critical information like support and resistance levels.Review The Data
The final step is to review all of the collated information collectively. This should give you a deep insight into your trades and can help you easily identify mistakes you made while trading. You can use this newly gathered information and implement it in your subsequent trades to improve your performance.
Conclusion
At the outset, trade analysis might seem like a complicated process. However, with enough effort and practice, you can easily master the various techniques used as part of the process. Remember, continuously improving your trading performance using the insights derived from the analysis of your trades is one of the keys to success. While important, most investors and traders miss a crucial element of trading - brokerage! Yes, brokerage can eat away at your profits. Hence, opting for Zero Brokerage is the ideal solution. So, open a Demat account with m.Stock and enjoy all your trades at zero brokerage equity delivery, mutual funds and IPOs.
More Related Articles
ETF trading rules from 7 September: What changes for retail investors?
 September 7, 2026 | 0 mins read
If there was no trade during the final 30 minutes on the previous day, the exchange will use that day’s last traded price. If there was no trade at all on the previous day, the latest available closing NAV will be used. The base price will also be adjusted for corporate actions, if applicable. From April 1, 2027, SEBI expects stock exchanges and mutual fund AMCs to use the previous day’s closing NAV as the base price after resolving operational issues.

How MSCI rebalancing tested India's Closing Auction System on August 31
September 2, 2026 | 0 mins read
India’s new Closing Auction Session (CAS) processed a record ₹39,718 crore turnover, on 31 August 2026 as MSCI India Index latest index rebalancing took effect at the market close. The event showed that CAS could handle an exceptional concentration of institutional flow. However, there were some sharp, and sometimes counterintuitive, stock moves. This shows that the quality of closing-price discovery is still being tested.
How Traders Use Maximum Drawdown to Manage Portfolio Risk?
August 19, 2026 | 0 mins read
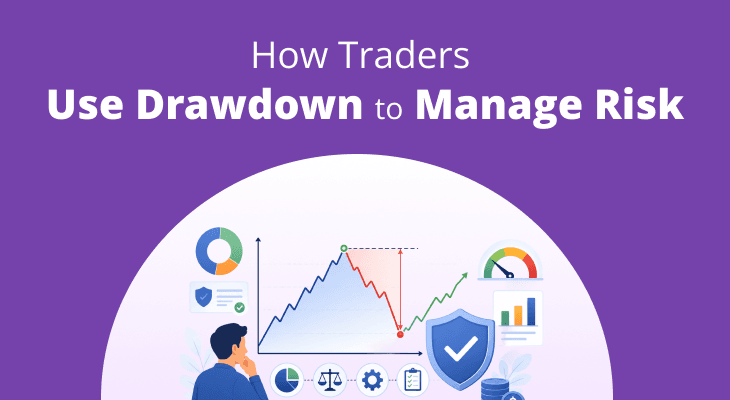
When evaluating an investment or trading strategy, returns usually receive the most attention. However, returns alone do not tell investors how much risk was taken to achieve them. Two portfolios may deliver the same annual return, but one may have experienced far steeper losses during market downturns. This is where max drawdown becomes useful. It measures the largest decline in the value of a portfolio, trading account, or investment from its highest point to its lowest point before a new peak is reached. Instead of focusing only on profits, it shows the worst historical loss an investor would have experienced by staying invested.