Continuation Patterns: Decoding Price Action
- What are continuation patterns?
- What are the types of continuation patterns?
- How are continuation patterns identified?
- What do continuation patterns depict?
Chart patterns are powerful tools that reveal the psychology behind price movements. These patterns, formed by price action, often repeat across different timeframes and market conditions, making them vital for traders. As trends mature and begin to consolidate, they frequently form identifiable shapes that hint at future direction.
Patterns generally fall into two broad categories: reversal patterns and continuation patterns. This chapter focuses on the latter, helping you understand how a trend may pause briefly before resuming its original path.
What is a Continuation Pattern?
A continuation pattern signals that the current trend is merely taking a breather and not reversing. After this short pause, the price typically continues moving in the same direction it was headed in before the pattern emerged.
Let’s dive into some of the most popular continuation patterns used by technical traders on platforms like m.Stock.
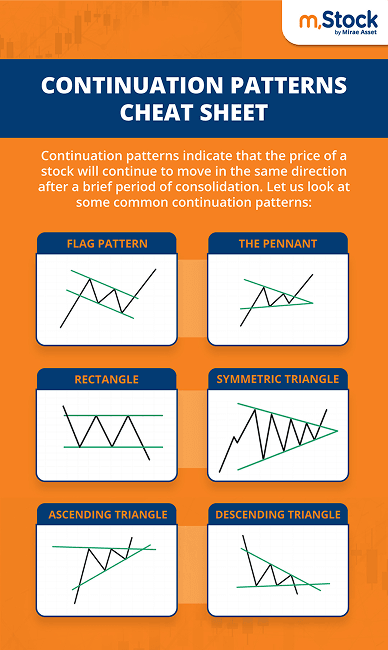
Flag & Pennant Patterns
These are among the most reliable short-term continuation patterns, often appearing after a sharp price move, known as the flagpole.
Flag Pattern
Structure: Rectangular shape with two parallel trendlines (support and resistance).
Behavior: Appears after a strong price rally or decline, followed by a sideways or slightly sloping consolidation.
Variations: Can slope upward, downward, or remain flat.
Trade Signal: Once price breaks above or below the flag boundary in the direction of the previous trend.
Target: Height of the flagpole from the breakout point.
Pennant Pattern
Structure: Small symmetrical triangle with converging trendlines.
Behavior: Forms after a sharp price move, consolidates in a tightening range.
Variations: Downward sloping in uptrends; upward sloping in downtrends.
Trade Signal: Trade only after breakout confirms the direction.
Target: Distance equal to the flagpole length from the breakout.
Both patterns can be bullish (following an uptrend) or bearish (after a downtrend), and are ideal for spotting high-momentum trades with clearly defined entry and exit points.
Triangle Patterns
Triangles show a narrowing price range that usually ends with a breakout. Depending on the slope and breakout direction, they can take different forms:
Symmetrical Triangle
Structure: Two converging trendlines, one descending (lower highs) and another ascending (higher lows).
Nature: Neutral or bilateral, can break out in either direction.
Trade Signal: Wait for a confirmed breakout to decide on the direction.
Risk Note: Prone to false breakouts, stop losses are essential.
Target: Width of the base of the triangle.

Ascending Triangle
Structure: Flat resistance line with an ascending support line.
Nature: Typically bullish, especially when formed during an uptrend.
Trade Signal: Buy after price breaks the horizontal resistance.
Target: Width between resistance and the rising trendline.
Descending Triangle
Structure: Flat support line with a descending resistance line.
Nature: Typically bearish, particularly during a downtrend.
Trade Signal: Sell after the support line is breached.
Target: Width between the resistance and the support line.
Each triangle type represents a different trader sentiment, ranging from indecision to growing bullish or bearish pressure.
Rectangle Patterns
Rectangles indicate a temporary sideways movement in the market where prices bounce between well-defined support and resistance levels.
Formation: Prices oscillate between horizontal support and resistance lines.
Bullish Rectangle: Appears after an uptrend, and a breakout to the upside signals trend continuation.
Bearish Rectangle: Forms after a downtrend, and a breakdown below support indicates continued weakness.
Trade Signal: Enter only after breakout or breakdown is confirmed.
Target: Distance between support and resistance lines.
While easy to identify, rectangles require discipline and patience. Breakouts can be sudden, and false signals are common, making risk control critical.

Points to Remember
Continuation patterns indicate a pause, not a reversal.
They offer clear setups for trend-following strategies.
Patterns like flags, pennants, triangles, and rectangles can be both bullish and bearish depending on context.
Confirmation and stop-losses are key to managing risk.