Elliott Waves: A Study of Market Patterns
- What is Elliott Wave Theory?
- Pros and cons of the Elliott Wave indicator
- Practical application and complexity of Elliott Waves
- Understanding how Elliott Wave Theory operates
Since ancient times, humanity has been fascinated by the idea of predicting the future. From monarchs and emperors to traders and commoners, the desire to foresee what lies ahead has always held power. In the world of trading, being able to anticipate price movements can mean the difference between profit and loss.
To forecast market trends, traders rely on various tools and models some driven by mathematics and probability, others by technical patterns and time cycles. Among the most well-known of these is the Elliott Wave Theory.
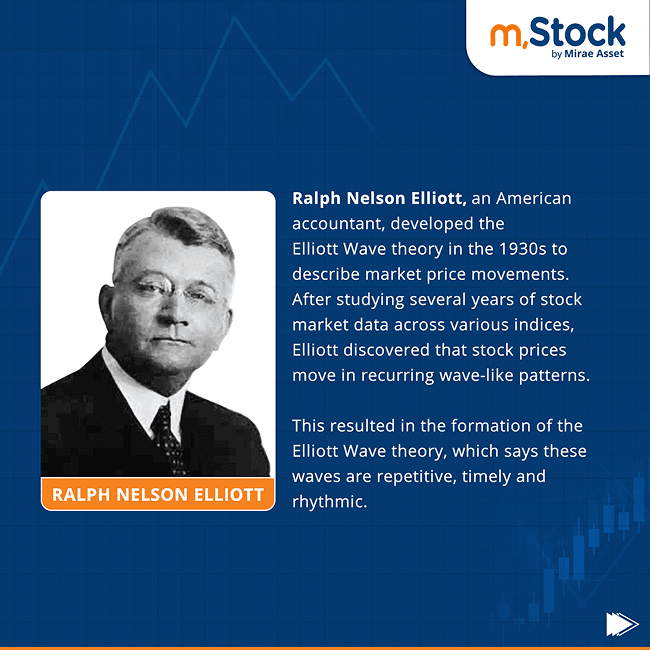
Originally developed by American accountant Ralph Nelson Elliott in the 1930s, the theory emerged after years of observing market indices. Elliott successfully predicted a market bottom in 1935, which helped his method gain recognition. Today, technical analysts who use this approach often refer to themselves as Elliotticians. The theory is widely used to identify market turning points and spot low-risk trading opportunities.
The Core Hypothesis Behind Elliott Waves
Elliott believed that collective investor psychology moved in repeating patterns, which he termed "waves." These wave structures mirrored fractals self-repeating patterns found in nature, like snowflakes or sea shells.
He observed that the same wave formations appeared across different timeframes, from large market cycles down to intraday movements. Remarkably, Elliott’s theory anticipated concepts that were mathematically validated decades later.
Later, he also connected these wave patterns to the Fibonacci sequence, adding mathematical depth to his theory.
Understanding Elliott Waves in the Markets
Elliott Wave patterns are intricate, requiring a deep understanding of wave degrees there are 15 in total. The idea is that market prices behave in rhythmic cycles, much like natural phenomena such as ocean tides. These cycles are largely driven by mass investor sentiment.
However, it's important to note that Elliott Wave Theory is not an exact science. It provides probable scenarios based on historical patterns not guarantees.
The Psychology Behind the Waves
The foundation of Elliott's theory lies in human emotion. Markets rise and fall as traders swing between optimism and pessimism. These collective mood shifts form wave-like price movements, observable across all timeframes.
Also Read: What is Swing Trading and How Does it Work? m.Stock
Large waves are made up of smaller waves, and by identifying the current wave phase, traders aim to predict what’s next in the sequence.
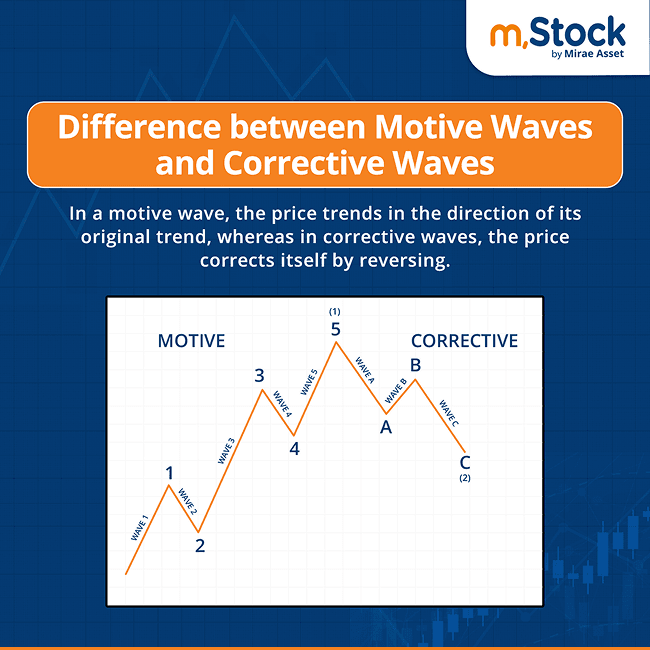
Two Types of Waves: Motive and Corrective
Motive (Impulse) Waves
These waves move in the direction of the primary market trend and are composed of five smaller waves. In a bullish trend, three waves move upward and two slightly pull back.
Corrective Waves
Corrective waves counter the primary trend. They consist of three smaller waves and reflect short-term pullbacks or corrections during a longer trend.
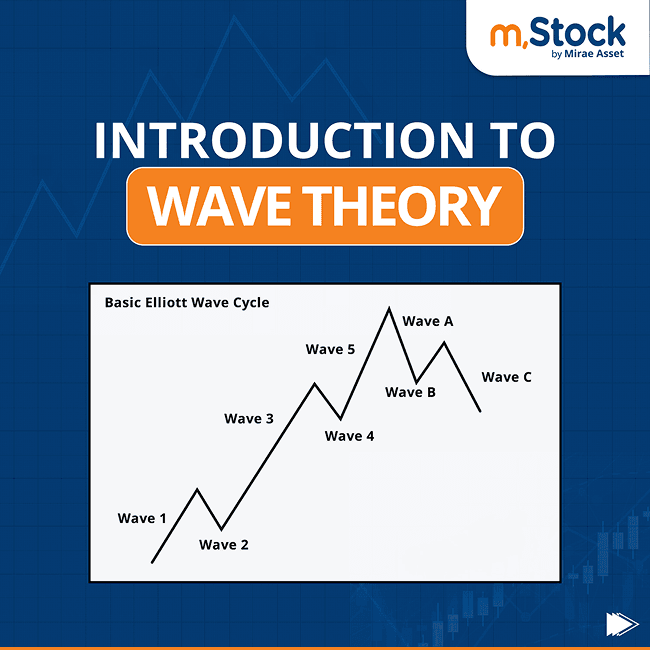
A Full Market Cycle: Step-by-Step
Let’s break down how a bull market evolves through the five-wave impulse pattern:
Wave 1: Early investors, sensing undervaluation, begin buying discreetly. Retail participation remains low as the broader market remains pessimistic.
Wave 2: Some early gains trigger profit booking. The market dips, but not below the lows of Wave 1. This is more of a pause than a reversal.
Wave 3: This is typically the most powerful wave. More traders and investors enter the market as momentum builds. Confidence grows and volume increases.
Wave 4: As gains accumulate, some investors again take profits. However, the correction is shallow. Retail interest spikes during this phase, eager not to miss out.
Wave 5: This is the euphoria phase. Everyone wants in. While prices shoot up quickly, smart money begins to exit. This is often the shortest wave in duration but very steep in price.
Corrective Phase: The Market Pullback

Once the five-wave impulse is complete, a corrective phase begins. This phase typically comprises three waves and represents a temporary retreat in prices before the next major trend resumes.

Within each wave, sub-waves mimic the larger pattern, reinforcing the fractal nature of market movements. The complete cycle is defined by a 5+3 wave structure.

Elliott Wave Rules to Remember
To use this method effectively, there are three cardinal rules:
Rule 1: Wave 2 cannot retrace more than 100% of Wave 1. That is, it should not fall below the start of Wave 1.
Rule 2: Wave 3 must not be the shortest of Waves 1, 3, and 5. It’s typically the longest and most powerful.
Rule 3: Wave 4 should not overlap Wave 1. The correction in Wave 4 should remain above the peak of Wave 1.
Does Elliott Wave Theory Actually Work?
One major criticism of the Elliott Wave approach is its subjectivity. Traders often interpret wave patterns differently, making consistency a challenge. Counting waves accurately requires practice and precision, which many retail traders find tedious.
Conclusion: A Tool with Probable Value
Like all technical tools, Elliott Waves are not foolproof. They require careful interpretation, discipline, and strong risk management. But for traders willing to master the theory, Elliott Waves can reveal high-probability opportunities within market trends.
At its core, the theory divides price action into two categories:
Motive (Impulse) Waves: in line with the trend
Corrective Waves: against the trend
While the concept is subjective, it holds value for traders who are consistent in their approach and disciplined in their analysis.