Momentum Indicators or Oscillators
- What are momentum indicators?
- Different types of momentum indicators
- How momentum indicators function in the stock market
- Role of momentum indicators in technical analysis
In the previous chapter, we briefly introduced the concept of momentum indicators, also referred to as oscillators. These are essential tools that help traders analyze both the trend direction and momentum strength of a security’s price.
Momentum indicators primarily rely on price data often in the form of moving averages to generate signals. These indicators typically oscillate within a set range, helping traders determine overbought or oversold conditions. Let’s now take a closer look at some widely used momentum indicators in the market.
Moving Average Convergence Divergence (MACD)
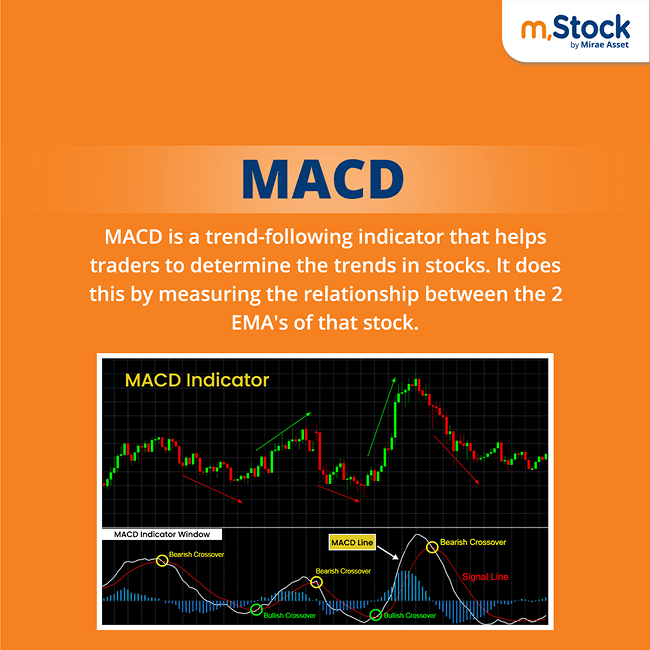
MACD is a highly popular indicator among technical traders as it captures both trend-following and momentum elements. It’s built using two exponential moving averages (EMAs), a 12-period EMA and a 26-period EMA. Subtracting the 26-period EMA from the 12-period EMA gives us the MACD line. A 9-period EMA of this MACD line acts as the signal line.
The MACD moves above and below a zero line, giving insight into the market momentum:
MACD Histogram: The difference between the MACD line and the signal line. A positive histogram suggests bullish momentum, while a negative histogram indicates bearish momentum.
Key Trading Signals from MACD:
Signal Line Crossover: Buy signal when MACD crosses above the signal line, sell signal when it crosses below.
Zero Line Crossover: Buy when MACD moves above the zero line, sell when it dips below.

Relative Strength Index (RSI)
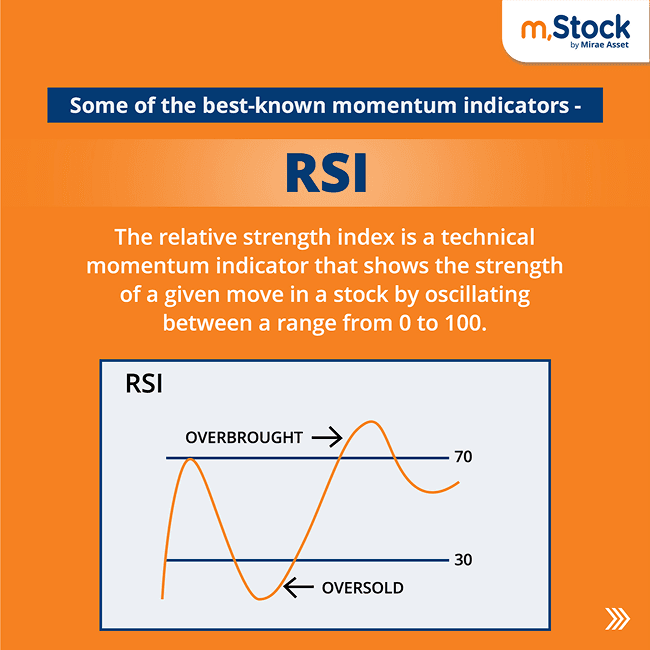
RSI is one of the most widely used oscillators globally. It measures the speed and change in price movements over a 14-period timeframe. The RSI generates values between 0 to 100, and traders interpret these ranges as follows:
Above 70: Overbought – potential reversal to the downside
Below 30: Oversold – potential reversal to the upside
Some traders use tighter thresholds of 80 and 20 for extreme conditions
The 50 mark serves as the neutral centerline:
RSI > 50 suggests a bullish trend
RSI < 50 indicates a bearish trend
RSI as a Pullback Tool:
In an uptrend, a dip in RSI toward 50 can be a buying opportunity
In a downtrend, an RSI pullback to 50 may signal a shorting opportunity

Stochastics Oscillator
The Stochastics oscillator consists of two lines that help identify trend reversals based on recent price ranges.
%K Line: Measures the current closing price relative to its high-low range over a set period
%D Line: A 3-day moving average of the %K line, providing smoother signals
This indicator also fluctuates between 0 to 100, with:
Above 80: Overbought
Below 20: Oversold
Trading With Stochastics:
A bullish crossover occurs when %K crosses above %D – indicating a buy
A bearish crossover occurs when %K crosses below %D – indicating a sell

Average Directional Index (ADX)
The ADX is another momentum indicator, but its specialty lies in measuring trend strength rather than direction.
It comprises three lines:
+DI (Positive Directional Indicator) – Signals upward movement
-DI (Negative Directional Indicator) – Signals downward movement
ADX Line – Represents the strength of the ongoing trend
Key Interpretations:
ADX between 25–50: Strong trend
ADX above 50–75: Very strong trend
ADX above 75: May indicate an unsustainable trend use caution
Trading With ADX:
Buy when +DI crosses above -DI (and ADX > 25)
Sell when -DI crosses above +DI (and ADX > 25)
This indicator is particularly helpful for identifying when a market is trending and when it’s ranging.

Points to Remember
Momentum indicators are best used alongside price action tools (like support/resistance or trendlines) for better reliability
Consistent practice is key to mastering these tools
Once understood, momentum indicators are straightforward and offer great visual cues
These indicators can sometimes offer false signals, especially during news driven volatility always use a stop loss and proper risk management