
August 19, 2026 | 11 min read
How Traders Use Maximum Drawdown to Manage Portfolio Risk?
When evaluating an investment or trading strategy, returns usually receive the most attention. However, returns alone do not tell investors how much risk was taken to achieve them. Two portfolios may deliver the same annual return, but one may have experienced far steeper losses during market downturns.
This is where max drawdown becomes useful. It measures the largest decline in the value of a portfolio, trading account, or investment from its highest point to its lowest point before a new peak is reached. Instead of focusing only on profits, it shows the worst historical loss an investor would have experienced by staying invested.
Understanding the meaning of max drawdown, and its principles, can help investors compare investment strategies, assess downside risk, and decide whether a portfolio's volatility matches your risk tolerance. Professional traders, fund managers, and long-term investors regularly monitor this metric because preserving capital is just as important as generating returns.
What Is Maximum Drawdown in Trading and Investing?
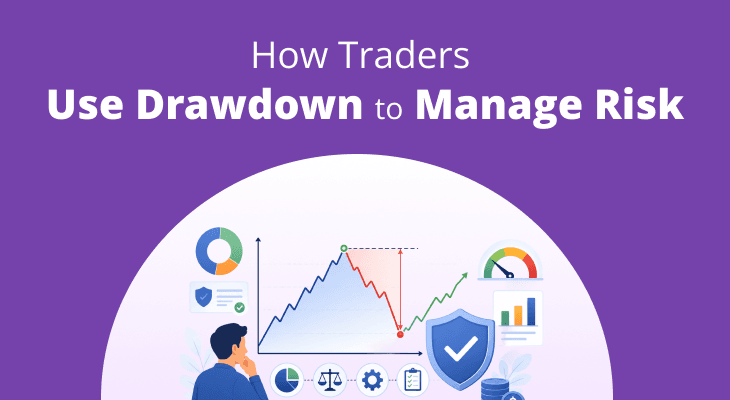
Maximum drawdown (MDD) is the largest percentage decline in the value of an investment, portfolio, or trading account from its highest value (peak) to its lowest value (trough) before it recovers to a new high.
In simple terms, it answers an important question: "What was the biggest loss this investment experienced before recovering?"
Unlike daily price changes, max drawdown focuses on the worst sustained decline over a given period. It does not measure temporary fluctuations or average losses. Instead, it highlights the deepest fall an investor would have had to endure if they had remained invested throughout that period.
For example, suppose your portfolio grows from ₹8 lakh to ₹10 lakh. During a market correction, its value falls to ₹7.5 lakh before eventually recovering to ₹11 lakh.
Here:
- Peak value = ₹10 lakh
- Lowest value before recovery = ₹7.5 lakh
The decline from ₹10 lakh to ₹7.5 lakh represents the portfolio's maximum drawdown during that period. Notice that the portfolio eventually reached a higher value of ₹11 lakh. However, max drawdown trading focuses only on the largest decline before the recovery occurred.
Maximum Drawdown vs Temporary Market Declines
Every investment experiences price fluctuations. Not every decline is a maximum drawdown.
Suppose a stock moves as follows:
₹500 → ₹490 → ₹510 → ₹495 → ₹540
Although the stock falls several times, none of these declines is particularly significant because new highs are reached quickly.
Now consider another sequence:
₹500 → ₹650 → ₹430 → ₹470 → ₹520 → ₹700
Here, the fall from ₹650 to ₹430 is the deepest decline before the stock makes a new high. This is the maximum drawdown during the observed period. The distinction is important because investors are generally more concerned about prolonged and substantial declines than small day-to-day price movements.
Why Doesn't Maximum Drawdown Measure Overall Returns?
A portfolio with high returns can still experience a large max drawdown if it undergoes sharp corrections along the way.
For instance:
Portfolio | Five-Year Return | Maximum Drawdown |
|---|---|---|
Portfolio A | 80% | 12% |
Portfolio B | 80% | 35% |
Although both portfolios generated identical returns, Portfolio B exposed investors to a much larger decline before recovering. For many investors, the smoother investment journey offered by Portfolio A may be preferable, especially if they have a lower tolerance for market volatility.
How Does Maximum Drawdown Measure Portfolio Risk?
Risk in investing is often associated with volatility, but volatility alone does not explain how much capital could be lost during adverse market conditions. Maximum drawdown provides a different perspective by measuring the magnitude of the worst historical decline.
Rather than asking, ‘’How much does the portfolio fluctuate?’’, it asks, ‘’How much could the portfolio fall before recovering?’'
This makes max drawdown particularly useful when evaluating downside risk.
Shows the Worst Historical Capital Decline
The primary purpose of maximum drawdown is to quantify the largest loss experienced over a specific period. In the previous example, although the long-term returns are identical, many investors would consider the first portfolio less risky because it preserved capital more effectively during difficult periods.
Helps Assess Emotional and Financial Risk
Large drawdowns are not just financial events. They can also test an investor's discipline. Suppose your portfolio falls from ₹20 lakh to ₹12 lakh during a market correction. Although the portfolio may recover over time, an investor who cannot tolerate such a decline might sell at the bottom, converting a temporary loss into a permanent one. By analysing historical max drawdown, investors can decide whether a particular strategy matches their risk appetite before investing.
Highlights Recovery Difficulty
One reason traders closely monitor maximum drawdown is that recovering from large losses becomes progressively harder.
Consider the following examples:
Portfolio Decline | Gain Required to Recover |
|---|---|
10% | 11.1% |
20% | 25.0% |
30% | 42.9% |
50% | 100.0% |
A portfolio that loses 50% of its value must double to return to its previous peak. This demonstrates why limiting drawdowns is often as important as generating strong returns.
Useful for Comparing Investment Strategies
Suppose two trading strategies produce similar long-term performance.
Strategy | Annual Return | Maximum Drawdown |
|---|---|---|
Strategy A | 16% | 14% |
Strategy B | 17% | 38% |
Although Strategy B earned slightly higher returns, many investors may still prefer Strategy A because it achieved nearly the same performance while exposing investors to considerably lower downside risk. This is why professional portfolio managers frequently compare returns together with maximum drawdown rather than evaluating returns in isolation.
Works Best Alongside Other Risk Measures
While max drawdown is valuable, it should not be used as the only measure of investment risk. It is often analysed alongside metrics such as volatility, Sharpe Ratio, Sortino Ratio, standard deviation, and risk-adjusted returns. Together, these measures provide a more complete picture of a portfolio's performance, helping investors assess not only how much a strategy earned but also the level of risk taken to achieve those returns.
How Do You Calculate Maximum Drawdown in Trading?
Once you understand the max drawdown meaning, the next step is learning how it is calculated. The objective is to identify the largest percentage decline from a portfolio's highest value to its lowest point before a new peak is achieved.
The calculation is based on three components:
- Peak value: The highest portfolio value reached during the period being analysed.
- Trough value: The lowest portfolio value recorded before the portfolio recovers to a new high.
- Percentage decline: The fall from the peak to the trough expressed as a percentage of the peak value.
The standard formula to calculate maximum drawdown is:
Maximum Drawdown (%) = (Peak Value − Trough Value) / Peak Value × 100
Step-by-Step Process
You can calculate maximum drawdown using the following approach:
Step 1: Identify the highest portfolio value during the selected period.
Step 2: Find the lowest value reached before the portfolio makes a new peak.
Step 3: Calculate the difference between the peak and the trough.
Step 4: Divide the decline by the peak value.
Step 5: Convert the result into a percentage.
The same method can be applied to an individual stock, a mutual fund, an ETF, a trading strategy, or an entire investment portfolio.
Choosing the Right Time Period
Your max drawdown depends on the period you analyse. For example, you may calculate maximum drawdown over:
- The past one year.
- The previous five years.
- A complete market cycle.
- The entire history of a trading strategy.
A longer observation period may capture deeper market corrections than a shorter one. Therefore, when comparing two investments, it is important to ensure that both are evaluated over the same timeframe.
Using Software to Calculate Maximum Drawdown
Professional traders rarely calculate maximum drawdown manually for large portfolios. Most modern trading platforms, portfolio trackers, and backtesting software automatically monitor equity curves and identify the deepest historical decline.
Even when software performs the calculation, understanding the underlying methodology helps you interpret the results correctly and avoid relying solely on a single performance metric.
Why Is Maximum Drawdown Important in Risk Management?
Most investors naturally focus on how much a portfolio can earn. However, equally important is understanding how much it could lose during unfavourable market conditions. Maximum drawdown helps answer this by highlighting the worst historical decline experienced by a portfolio or trading strategy.
Rather than predicting future losses, it provides a realistic view of downside risk based on past performance. This makes it a valuable tool for portfolio construction, strategy evaluation, and capital preservation.
Here are some of the key ways max drawdown supports risk management.
- Helps set realistic expectations: Every investment experiences periods of decline. Knowing the historical maximum drawdown gives investors a better idea of the level of volatility they may encounter and helps avoid unrealistic return expectations.
- Supports position sizing: Traders often adjust their position sizes based on the historical drawdown of a strategy. A strategy with larger drawdowns may warrant smaller allocations to limit the impact of adverse market movements.
- Improves portfolio diversification: Comparing the drawdowns of different asset classes or strategies can help you build a portfolio with a more balanced risk profile rather than concentrating investments in highly volatile assets.
- Evaluates strategy consistency: Two trading strategies may generate similar returns, but the one with a lower max drawdown may offer a smoother investment journey and be easier to follow during market corrections.
- Assists in risk control: Many professional traders define a maximum acceptable drawdown for their portfolio. If losses exceed this level, they may reduce exposure, review their strategy, or temporarily pause trading until market conditions improve.
While maximum drawdown should not be the only measure used to assess risk, it provides valuable context when combined with other metrics such as volatility and risk-adjusted returns.
Maximum Drawdown Example in Trading Explained
Let's see how to calculate maximum drawdown using a practical trading scenario. Suppose a trader starts with a portfolio worth ₹10 lakh. Over the next few months, the portfolio value changes as follows:
Month | Portfolio Value |
|---|---|
January | ₹10,00,000 |
February | ₹11,50,000 |
March | ₹13,00,000 |
April | ₹11,80,000 |
May | ₹10,40,000 |
June | ₹9,75,000 |
July | ₹11,20,000 |
August | ₹13,80,000 |
The highest value before the decline is ₹13,00,000 in March. The lowest value before a new high is reached is ₹9,75,000 in June.
Applying the formula: Maximum Drawdown =( (₹13,00,000 − ₹9,75,000) / ₹13,00,000) × 100
= ₹3,25,000 / ₹13,00,000 × 100 = 25%
This means the portfolio lost 25% from its peak before recovering and eventually reaching a new high in August.
What Are the Benefits and Limitations of Maximum Drawdown Analysis?
Like any performance metric, maximum drawdown provides valuable insights but also has limitations. It is most effective when interpreted alongside other measures rather than being used on its own.
Benefits of Maximum Drawdown
- Simple to understand: The concept is intuitive because it measures the largest historical loss from a peak, making it easy for both beginners and experienced investors to interpret.
- Focuses on downside risk: Unlike return-based metrics, max drawdown highlights the extent of potential losses, helping investors evaluate whether a strategy matches their risk tolerance.
- Useful for comparing investments: When two portfolios generate similar returns, comparing their drawdowns can reveal which strategy has historically managed risk more effectively.
- Supports better portfolio management: Investors can use drawdown analysis to review asset allocation, adjust position sizes, and improve diversification when a portfolio is exposed to excessive downside risk.
- Encourages disciplined investing: Monitoring drawdowns helps investors avoid excessive risk-taking and reinforces the importance of protecting capital during volatile market conditions.
Limitations of Maximum Drawdown
- Based only on historical data: A low historical drawdown does not guarantee that future losses will remain limited. Market conditions can change significantly over time.
- Does not show how long recovery takes: Two portfolios may have the same drawdown, but one could recover within weeks while another may take several years. Maximum drawdown measures the depth of the decline, not the recovery period.
- Ignores return consistency: It identifies only the single largest decline and does not capture how frequently smaller losses occur throughout the investment period.
- Sensitive to the analysis period: Changing the start or end date can produce a different drawdown value. Comparing investments over different timeframes may therefore lead to misleading conclusions.
For these reasons, professional investors typically use maximum drawdown together with measures such as annual returns, volatility, Sharpe Ratio, and Sortino Ratio to obtain a more comprehensive view of portfolio performance.
Conclusion
Maximum drawdown is one of the most practical risk metrics available to investors and traders because it shifts the focus from returns alone to the losses experienced along the way. It measures the largest decline from a portfolio's peak before recovery, helping investors understand the downside risk associated with an investment or trading strategy.
While learning to calculate maximum drawdown is straightforward, interpreting it correctly is equally important. A strategy with slightly lower returns but a significantly smaller drawdown may be more suitable for investors seeking steadier performance and better capital preservation.
Since no single metric can fully assess investment risk, max drawdown should be used alongside other performance and risk measures. Together, they provide a more balanced framework for evaluating portfolios and making informed investment decisions.
More Related Articles

SEBI Proposes CAS Changes: What Could Change for Derivatives Settlement, IEPs & Timings?
 September 17, 2026 | 0 mins read
A month after introducing the new Closing Auction Session, SEBI has proposed changes after early market feedback raised concerns about derivatives settlement on expiry days, changing auction prices and trading timings. SEBI is not scraping CAS. Instead, it wants to make expiry settlement clearer, improve the auction process and help traders understand that indicative auction prices are not the same as actual traded prices.

ETF trading rules from 7 September: What changes for retail investors?
September 7, 2026 | 0 mins read
If there was no trade during the final 30 minutes on the previous day, the exchange will use that day’s last traded price. If there was no trade at all on the previous day, the latest available closing NAV will be used. The base price will also be adjusted for corporate actions, if applicable. From April 1, 2027, SEBI expects stock exchanges and mutual fund AMCs to use the previous day’s closing NAV as the base price after resolving operational issues.

How MSCI rebalancing tested India's Closing Auction System on August 31
September 2, 2026 | 0 mins read
India’s new Closing Auction Session (CAS) processed a record ₹39,718 crore turnover, on 31 August 2026 as MSCI India Index latest index rebalancing took effect at the market close. The event showed that CAS could handle an exceptional concentration of institutional flow. However, there were some sharp, and sometimes counterintuitive, stock moves. This shows that the quality of closing-price discovery is still being tested.
FAQ
Maximum drawdown measures only the largest historical decline and does not predict future losses. It also ignores recovery time, return consistency, and the frequency of smaller declines. Therefore, it should be used alongside other risk metrics instead of as a standalone measure.