
September 16, 2026 | 13 min read
Sonaselection India IPO, Dates, price band, business model, financials, valuation and the key investor monitorables
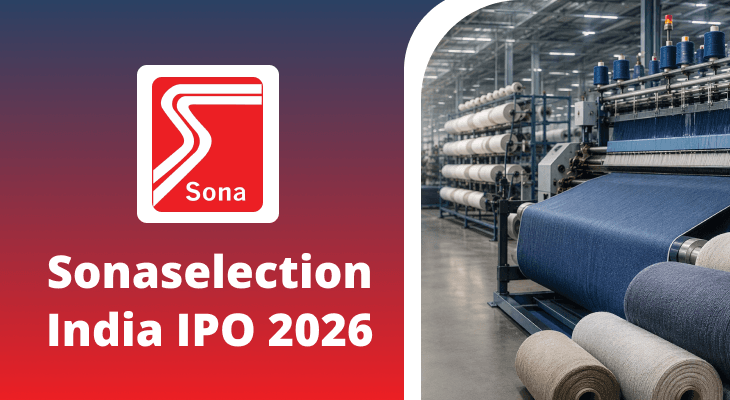
Sonaselection India is an integrated fabric manufacturer and processor based in Bhilwara, Rajasthan. It manufactures 100% cotton, cotton lycra, cotton-blend and polyester-blend fabrics, and also processes customer-owned greige fabric on a job-work basis. The business changed materially after a cotton fabric processing plant became operational in July 2024. Manufacturing revenue rose from 11.28% of revenue from operations in FY24 to 82.70% in FY26. Revenue consequently expanded at a 106.71% CAGR over FY24-FY26, but the more inventory-heavy model also pushed working-capital days higher and kept operating cash flow negative in FY25 and FY26.
The ₹141.57 crore issue at the upper price band is entirely a fresh issue. Up to ₹80 crore is earmarked for debt repayment and ₹50.61 crore for plant and machinery at the existing facility. There is no offer for sale, so the economic test is straightforward: whether deleveraging and productivity capex can improve cash conversion, margins and returns after listing.
Sonaselection IPO Dates and Launch Details
Detail | Information |
|---|---|
Issue opens | 17 September 2026 |
Issue closes | 21 September 2026 |
Basis of allotment | On or about 22 September 2026 |
Credit to demat / refunds | On or about 23 September 2026 |
Tentative listing | 24 September 2026 |
Proposed listing |
Price Band and Investment Details
Detail | Information |
|---|---|
Price band | ₹94 to ₹99 per equity share |
Face value | ₹10 per equity share |
Minimum bid | 150 shares and multiples of 150 |
Minimum retail application | ₹14,850 at ₹99 |
Issue type | 100% book-built, entirely fresh issue |
BRLM | Choice Capital Advisors |
Registrar |
At the upper band, a one-lot application requires ₹14,850. Because the issue contains no OFS, gross proceeds accrue to the company rather than selling shareholders. The fresh equity also dilutes the promoter and promoter-group holding from 86.22% before the issue to 64.52% after it.
IPO Structure and Use of Proceeds
Use | Amount | Share of cap-band issue | Why it matters |
|---|---|---|---|
Debt repayment / prepayment | Up to ₹80.00 crore | 56.51% | Could reduce borrowings and finance-cost pressure |
Plant and machinery | ₹50.61 crore | 35.75% | Targets productivity, quality and processing capability at the existing facility |
General corporate purposes | Balance | About 7.74% | Supports ordinary corporate requirements, subject to final expenses |
Debt repayment is economically meaningful. FY26 total borrowings were ₹258.24 crore, so ₹80 crore is equivalent to about 31% of that year-end amount before considering subsequent movements. Finance costs had risen from ₹4.75 crore in FY24 to ₹17.69 crore in FY26. The actual saving will depend on which facilities are repaid, their interest rates and the timing of deployment. The ₹50.61 crore machinery programme should be judged on output per metre, rejection rates, energy and chemical efficiency, product mix and incremental ROCE not merely on the amount spent. With FY26 processing utilisation already at 82.71%, better throughput and higher-value products could help, but installation shutdowns and slower-than-planned ramp-up are execution risks.
About Sonaselection India
The company was incorporated on 11 February 2022 and acquired a running textile processing unit from group company Sona Processors (India) Limited through a slump sale in June 2022. It initially earned predominantly from processing fabric supplied by customers. The commissioning of its own cotton fabric processing plant in July 2024 moved the economics towards purchasing yarn or greige fabric, processing it and selling finished fabric.
Its wholly owned subsidiary, Sionnah Enterprises, was incorporated on 1 July 2025 and introduced a small readymade-garment revenue stream in FY26. This adds downstream optionality, but the subsidiary is at an early stage and should not yet be treated as a proven earnings engine.
How the Business Model Works
- Manufacturing: the company procures greige fabric, or buys yarn that is converted into greige fabric through outsourced job work. Bleaching, dyeing and finishing are then performed in-house before finished fabric is sold.
- Job-work processing: customers supply greige fabric and specify the required quality, colour and finish. Sonaselection earns a processing fee without carrying the same raw-material ownership risk.
- Readymade garments: the subsidiary sells finished apparel. It accounted for only about 1.20% of FY26 revenue, so execution and working-capital behaviour remain untested.
The mix shift matters. Manufacturing offers a larger revenue pool and more control over quality and delivery, but it requires the company to fund yarn, greige fabric, work-in-progress and customer credit. Job work is smaller in revenue terms but normally requires less balance-sheet funding because the customer owns the input fabric.
What the Operating Metrics Say
Metric | FY24 | FY25 | FY26 / latest |
|---|---|---|---|
Installed processing capacity | 54.00 mn metres p.a. | 82.44 mn metres p.a. | 82.44 mn metres p.a. |
Capacity utilisation | 89.50% | 78.24% | 82.71% |
Processed volume | 48.33 mn metres | 64.50 mn metres | 68.19 mn metres |
Manufacturing / sale of goods | 11.28% | 69.88% | 82.70% |
Job-work / sale of services | 88.72% | 30.12% | 17.30% |
Customers served | 191 | 417 | 909 |
Top 10 customers | 48.15% | 37.98% | 29.45% |
Top 10 suppliers | 77.52% | 80.74% | 58.87% |
Rajasthan share of revenue | 95.31% | 50.47% | 37.31% |
Employees | - | - | 979 at 31 July 2026 |
FY26 processed volume of about 68.19 million metres was only 5.7% higher than FY25, while revenue rose 63.6%. This suggests that the manufacturing mix, ownership of raw materials and realisation per metre were more important growth drivers than physical throughput alone. Investors should therefore separate accounting revenue growth from volume growth.
Customer breadth improved: customers served rose to 909 and top-10 concentration fell to 29.45%. Yet the company generally operates through purchase orders rather than long-term contracts. Diversification reduces dependence on one account, but does not create contracted revenue visibility.
Facility, Technology and Supply Chain
The single manufacturing facility at Hamirgarh, Bhilwara covers about 49,540 sq. metres and has annual processing capacity of 82.44 million metres. It houses singeing, desizing, scouring, bleaching, mercerising, dyeing, stentering, sanforising, sueding and pressing equipment, an in-house quality laboratory and warehousing capacity of roughly five million metres.
The site also has 1.20 MW of rooftop solar capacity and a zero-liquid-discharge effluent treatment system. These assets can support energy resilience and environmental compliance, but textile wet processing remains exposed to power, water, chemical and regulatory costs.
Yarn and greige fabric are the primary inputs. The company does not typically enter long-term fixed-price supply contracts, leaving margins exposed to cotton, yarn and greige-fabric price swings. Procurement concentration improved in FY26, but 58.87% from the top 10 suppliers remains material. Purchases and processing from group company Sona Styles Limited also create related-party dependency that deserves monitoring.
Sonaselection India Financial Performance: Scale Improved, but Cash Conversion Lagged
₹ crore, unless stated | FY24 | FY25 | FY26 |
|---|---|---|---|
Revenue from operations | 120.98 | 315.95 | 516.95 |
Year-on-year growth | - | 161.16% | 63.62% |
EBITDA | 28.49 | 58.12 | 84.77 |
EBITDA margin | 23.55% | 18.39% | 16.40% |
Profit after tax | 13.10 | 18.56 | 34.02 |
PAT margin | 10.82% | 5.88% | 6.58% |
Cash flow from operations | 17.61 | (14.18) | (10.99) |
Capital expenditure | 105.29 | 49.89 | 22.96 |
Free cash flow | (87.69) | (64.06) | (33.95) |
1. Revenue growth reflects a different business, not only a larger one
Revenue rose from ₹120.98 crore in FY24 to ₹516.95 crore in FY26, a 106.71% two year CAGR. The sharpest increase came in FY25, when the manufacturing model scaled after the July 2024 commissioning. Sale of goods moved from 11.28% to 69.88% of revenue, then to 82.70% in FY26.
That distinction is important because own-account manufacturing records the sale value of finished fabric, whereas job work records a processing fee. Some growth therefore represents a change in revenue architecture as well as capacity, customers and output. The monitorable is revenue growth alongside metres processed and realisation, not revenue in isolation.
2. EBITDA expanded, but the margin normalised
EBITDA increased from ₹28.49 crore in FY24 to ₹84.77 crore in FY26. However, EBITDA margin declined from 23.55% to 18.39% and then 16.40%. A manufacturing-led model carries the cost of raw materials through the income statement, so a lower percentage margin than fee-based job work is not automatically evidence of weaker economics.
The relevant test is whether absolute EBITDA, gross contribution per metre and ROCE continue to improve without requiring disproportionate working capital. Raw-material pass-through, product mix, utilisation and energy/chemical efficiency will determine whether the FY26 margin is defensible.
3. PAT recovered, but interest remains meaningful
PAT grew 83.3% in FY26 to ₹34.02 crore and PAT margin recovered to 6.58% from 5.88% in FY25, although it remained below FY24's 10.82%. Finance costs were ₹17.69 crore in FY26, equal to about 20.9% of EBITDA. This is why the proposed ₹80 crore debt repayment can matter: lower interest expense could improve conversion from EBITDA to PAT if operating performance holds.
4. Cash flow is the harder part of the story
Operating cash flow was negative ₹14.18 crore in FY25 and negative ₹10.99 crore in FY26 even though PAT was positive. The divergence reflects a build-up in inventory and receivables as manufacturing scaled. Free cash flow remained negative in all three years, although the deficit narrowed as the earlier expansion capex moderated.
This does not negate the growth, but it changes how it should be financed and valued. If inventories and receivables continue to grow faster than sales, debt reduction from the IPO may be partly offset by renewed working-capital borrowing. Cash conversion is therefore a first-order monitorable, not a secondary accounting detail.
Operating And Capital Efficiency Ratios
₹ crore / ratio | FY24 | FY25 | FY26 |
|---|---|---|---|
Debt-equity | 3.72x | 2.96x | 2.48x |
RoNW | 40.46% | 34.08% | 39.05% |
ROCE | 16.18% | 16.97% | 19.69% |
Asset turnover | 0.59x | 1.08x | 1.20x |
Borrowings increased by ₹113.64 crore between FY24 and FY26 as the company funded capacity and working capital. Debt-equity nevertheless fell because net worth grew faster. ROCE rose to 19.69% and asset turnover improved, indicating that the expanded asset base generated more revenue and operating return. The caveat is that the return profile has not yet translated into operating cash generation.
Working Capital: Growth Is Consuming Cash
Metric | FY24 | FY25 | FY26 |
|---|---|---|---|
Days working capital | 104 | 122 | 134 |
Inventory days | 127 | 115 | 150 |
Debtor days | 44 | 48 | 61 |
Creditor days | 54 | 57 | ~79 |
Cash conversion cycle | 117 | 106 | ~132 |
Days working capital rose from 104 in FY24 to 134 in FY26. Inventory days increased sharply to 150, while debtor days reached 61. Supplier credit provided some offset, but the cash conversion cycle still lengthened to roughly 132 days. The economic meaning is simple: more cash is tied up for longer between buying inputs and collecting from customers. The key post-listing evidence will be whether inventory days fall as the manufacturing plant matures and whether receivable growth remains below revenue growth.
Sector and Market Context
The RHP's CareEdge industry report estimates India's textile and apparel industry at about US$188 billion in FY26 and projects US$350 billion by FY30, a 16.8% CAGR. Fabrics account for roughly 50-60% of industry value, making processing and value-added fabric a large addressable segment.
For Sonaselection, the more relevant drivers are domestic apparel demand, the shift towards value-added cotton and blended fabrics, buyer preference for quality and shorter lead times, and the modernisation of wet processing. Bhilwara's cluster of more than 400 spinning, weaving and dyeing units supports access to suppliers, labour and ancillary services.
The industry opportunity comes with structural constraints. Textile processing is fragmented, price competitive and sensitive to cotton/yarn, dyes, chemicals, power and water. Environmental compliance is increasingly important. Sonaselection's ZLD system and rooftop solar capacity are useful operating assets, but they do not eliminate cost inflation or compliance risk.
Valuation: Headline P/E Needs a Dilution Lens
Metric | At ₹94 | At ₹99 | Interpretation |
|---|---|---|---|
FY26 EPS disclosed in RHP | ₹8.09 | ₹8.09 | Based on pre-issue weighted shares |
P/E on disclosed FY26 EPS | 11.62x | 12.24x | Prospectus-style headline multiple |
Post-issue EPS (derived) | ₹5.99 | ₹5.99 | FY26 PAT divided by post-issue shares |
P/E on post-issue EPS | 15.69x | 16.53x | Captures fresh-share dilution, before use-of-proceeds benefits |
Post-issue market capitalisation | ₹534.19 crore | ₹562.60 crore | Based on 5.68 crore post-issue shares |
The RHP identifies Nitin Spinners, Sangam (India) and Vishal Fabrics as listed peers, with disclosed P/E ratios ranging from 12.23x to 37.29x and an average of 22.58x. That range is broad because the peers differ in scale, integration, product mix, leverage and cycles. A lower multiple is not automatically cheap if the company has shorter operating history, higher leverage and weaker cash conversion.
At ₹99, the headline FY26 P/E is 12.24x on the RHP EPS. On a simple post-issue share-count basis, it is about 16.53x. The gap matters, but so does the other side of the transaction: ₹80 crore of debt repayment may reduce finance costs, while capex may add earnings over time. The appropriate monitor is post-issue earnings and cash flow after both dilution and proceeds deployment.
Potential Strengths
- A clear manufacturing transition: sale of goods rose to 82.70% of FY26 revenue and revenue reached ₹516.95 crore.
- A scaled processing asset: 82.44 million metres of annual capacity, 82.71% utilisation, an integrated wet-processing line, quality laboratory and substantial warehousing.
- Broader customer and geographic reach: 909 customers in FY26, lower top-10 concentration and Rajasthan's revenue share falling to 37.31%.
- Improving capital efficiency: ROCE increased to 19.69% and asset turnover improved as the enlarged facility scaled.
- Fresh capital goes into the business: there is no OFS, and most proceeds are directed to debt reduction and machinery.
Key Risks and What They Mean
Risk | Evidence | Economic implication | Monitor |
|---|---|---|---|
Single facility | All core processing is at Bhilwara | A shutdown can interrupt nearly the entire operating chain | Downtime, insurance, maintenance and contingency plans |
Working-capital intensity | 134 working-capital days; negative FY25-FY26 CFO | Growth may require continued external funding | Inventory, debtor days and CFO/PAT |
Leverage | ₹258.24 crore FY26 borrowings; 2.48x debt-equity | Interest and refinancing reduce flexibility | Debt after IPO and finance-cost savings |
Raw-material volatility | Yarn and greige fabric bought without long-term fixed prices | Input spikes can compress margins or raise inventory needs | Gross contribution, EBITDA margin and stock levels |
Supplier / related-party dependence | Top 10 suppliers: 58.87%; group-company procurement | Disruption or non-arm's-length economics can affect supply and margins | Supplier mix and related-party transactions |
Short operating history | Incorporated in 2022; plant commissioned July 2024 | The current model has not been tested across a full textile cycle | Multi-year margins, cash conversion and utilisation |
Limited exports | 99.84% of FY26 revenue was domestic | Domestic diversification improved, but export optionality is unproven | Export mix and customer quality |
RMG execution | New subsidiary and only a small FY26 contribution | Forward integration may consume capital before scale | Segment revenue, margin and working capital |
Opportunities That Could Improve the Profile
- Convert manufacturing scale into cash: lower inventory and debtor days would allow revenue growth to fund itself more effectively.
- Use debt repayment to lift PAT conversion: a sustained reduction in borrowings and finance costs could improve earnings quality.
- Raise value per metre: specialised cotton lycra, blends and advanced finishes can matter more than raw throughput if they carry better contribution.
- Improve efficiency through machinery: lower energy, chemical, reprocessing and rejection costs could defend margins even without major capacity expansion.
- Build selective garment integration: Sionnah can add downstream value if it grows without recreating the working-capital burden at another layer.
Post-listing Monitorables
Monitorable | Why it matters | What improvement would look like |
|---|---|---|
CFO and free cash flow | Tests the quality of reported profit | Positive CFO, narrowing FCF deficit and better CFO/PAT |
Inventory and debtor days | The main cash absorption points | A reversal from FY26's 150 and 61 days |
Debt and finance costs | Validates the ₹80 crore repayment object | Lower absolute debt, debt-equity and interest expense |
Capacity utilisation and metres processed | Separates volume growth from mix/accounting effects | Higher output without bottlenecks or disproportionate capex |
EBITDA margin | Shows raw-material pass-through and operating efficiency | Stability around or above FY26 while manufacturing remains dominant |
ROCE | Tests whether machinery and working capital create value | ROCE holding or improving after fresh capital enters |
Customer and supplier concentration | Measures commercial resilience | No reversal in diversification; less group-company dependency |
RMG contribution | Tracks the new forward-integration option | Transparent segment economics and disciplined working capital |
Conclusion
Sonaselection enters the IPO with a genuine transformation story. In two years, it moved from predominantly job-work processing to a manufacturing-led model, expanded capacity and customers, lifted revenue to ₹516.95 crore and improved ROCE to 19.69%. The all-fresh issue can also address two visible needs: leverage and machinery productivity. The same transformation makes the financial picture more demanding. Manufacturing requires the company to own raw materials and extend customer credit; FY26 inventory was ₹153.85 crore, trade receivables ₹103.70 crore and operating cash flow remained negative. EBITDA margin has also normalised as fee income gave way to raw-material-bearing product sales.
The balanced assessment therefore rests on execution after the IPO. Debt should fall, finance costs should ease and new machinery should improve productivity. But the decisive evidence will be positive cash conversion, stable margins, disciplined inventory and receivables, and ROCE that remains healthy after the larger equity base. The price band provides a starting valuation; the post-listing operating record will determine whether the manufacturing transition creates durable value.
Disclaimer: This blog is only for educational and informational purposes and does not constitute investment advice. Please consult your financial advisor before taking any investment decisions.
More Related Articles

Manika Plastech Ltd IPO Day 4 Subscription Status
 September 16, 2026 | 0 mins read
Manika Plastech Ltd is launching its IPO on 11 Sep 26. Check here the Day 4 IPO subscription status on m.Stock.
Hero Motors Ltd IPO Day 1 Subscription Status
September 16, 2026 | 0 mins read
Hero Motors Ltd is launching its IPO on 16 Sep 26. Check here the Day 1 IPO subscription status on m.Stock.
SS Retail Ltd IPO Day 1 Subscription Status
September 16, 2026 | 0 mins read
SS Retail Ltd is launching its IPO on 16 Sep 26. Check here the Day 1 IPO subscription status on m.Stock.
FAQ
The company is offering up to 1,43,00,000 fresh equity shares. At the upper price band of ₹99, the issue size is ₹141.57 crore. There is no offer for sale.