
May 22, 2026 | 3 min read
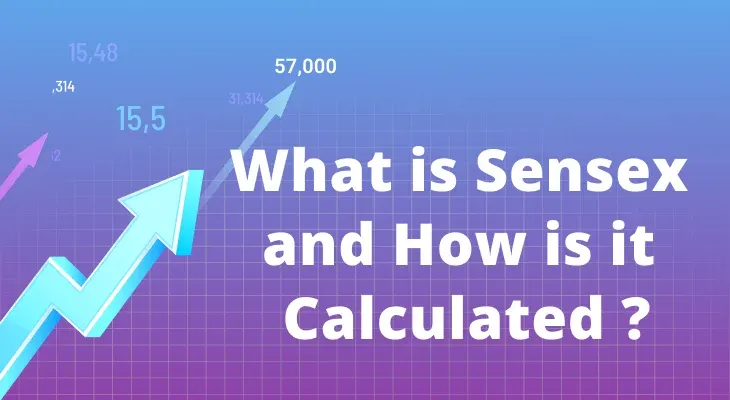
What is Sensex and How is it Calculated?
What is Sensex?
The term, SENSEX was coined in 1989 by a stock market analyst, Deepak Mohoni, and is the combination of the words ‘sensitive’ and ‘index’. With a base value of 100, Sensex is currently trading at < VAR > levels, growing at an absolute rate of < VAR >%. Sensex is a weighted average combination of 30 of the biggest and most actively traded companies listed on the Bombay Stock Exchange.
Sensex has had remarkable expansion ever since it first opened in the 1990s, particularly after 2000. For instance, information technology firms contributed to the index's first crossing of the 6000 mark in 2002. From that moment on, Sensex grew from strength to strength, closing at 39,056.65 on April 2, 2019, breaking beyond 39,000 points for the first time. The significant rise in India's Gross Domestic Product (GDP) since the turn of the century is responsible for this growth curve.
The 30 companies which make up the index is selected by the S&P BSE Index Committee based on the following criteria:
Company must be listed on the Bombay Stock Exchange.
Company must be large-cap with market capitalisation of more than Rs 25,000 crores
Company must be actively traded i.e. liquid.
30 Sensex Companies
| S No. | Company Name | Weight in Sensex |
|---|---|---|
| 1 | Reliance Industries Ltd. | 11.99% |
| 2 | HDFC Bank | 11.84% |
| 3 | Infosys Ltd. | 9.06% |
| 4 | HDFC | 8.30% |
| 5 | ICICI BANK | 7.37% |
| 6 | TCS | 5.76% |
| 7 | KOTAK BANK | 4.88% |
| 8 | HINDUNILVR | 3.75% |
| 9 | ITC | 3.49% |
| 10 | AXISBANK | 3.35% |
| 11 | L&T | 3.13% |
| 12 | BAJFINANCE | 2.63% |
| 13 | SBIN | 2.59% |
| 14 | BHARTIARTL | 2.31% |
| 15 | ASIAN PAINTS | 1.97% |
| 16 | HCLTECH | 1.89% |
| 17 | MARUTI | 1.72% |
| 18 | M&M | 1.48% |
| 19 | ULTRACEMCO | 1.40% |
| 20 | SUNPHARMA | 1.16% |
| 21 | TECHM | 1.11% |
| 22 | TITAN | 1.11% |
| 23 | NESTLEIND | 1.07% |
| 24 | BAJAJFINSV | 1.04% |
| 25 | INDUSINDBK | 1.03% |
| 26 | POWERGRID | 1.03% |
| 27 | TATASTEEL | 1.01% |
| 28 | NTPC | 0.94% |
| 29 | BAJAJ AUTO | 0.86% |
| 30 | ONGC | 0.73% |
Sensex Calculation
To guarantee that it accurately reflects the state of the stock market , BSE periodically adjusts the share composition of the Sensex. The weighted technique of market capitalization was initially used to compute the index. But this computation approach has been updated since 2003 and now incorporates a free-float capitalization method.
This free-float technique is an alternative to the market-capitalization method in which the index is calculated using the number of shares available for sale under a corporation rather than the number of outstanding shares. Thus, restricted stocks (those held by corporate insiders) that are not for sale are not included in this strategy.
A company's market capitalization (outstanding shares X share price) is multiplied by free-float factor to obtain its free-float capitalization. The ratio of issued shares to outstanding shares is this factor. The index level consistently represents the free-float value of the 30 listed companies that make up the Sensex, relative to a base period, in accordance with this free-float capitalization technique.
Significant drops in Sensex
Between 2008 and 2009, a stock market crash and a decline in the intraday trading of the Dow Jones industrial average contributed to a serious crisis in the global economy. The stock market in India was also negatively impacted by this catastrophe, suffering its largest point loss ever on January 21st, 2008, losing 1408 points, leading to trading being halted for an hour the following day.
Sensex continually declined from January through November 2008, creating concern throughout the market. The market reached its lowest point in the past ten years in October 2008, closing at 8509.56 points.In 2009, the Satyam fraud caused the index to decline by roughly 750 points, upsetting the market.
In 2020, when the lockdown was announced to contain the pandemic, Sensex fell from 41,000 levels in February 2020 to 27,500 levels in April 2020.
Despite the ups and downs, Sensex has maintained its status as the top stock market index in the country over the past 30 years. Since tracking and investing in individual stocks can be exceedingly challenging for investors, Sensex gives an easy access to the top, most traded and liquid stocks in the country. Trade in Sensex stocks at ₹10 brokerage with m.Stock. Open an account now!
More Related Articles
Understanding the meaning and benefits of the systematic trading system
 October 23, 2026 | 0 mins read
A systematic trader is an individual who uses a predesigned and backtested trading strategy to buy and sell financial instruments such as stocks, futures, currencies, or commodities. Instead of relying on gut feelings or emotions, they use a systematic trading system built on predefined rules, quantitative analysis, and technology to make trading decisions.
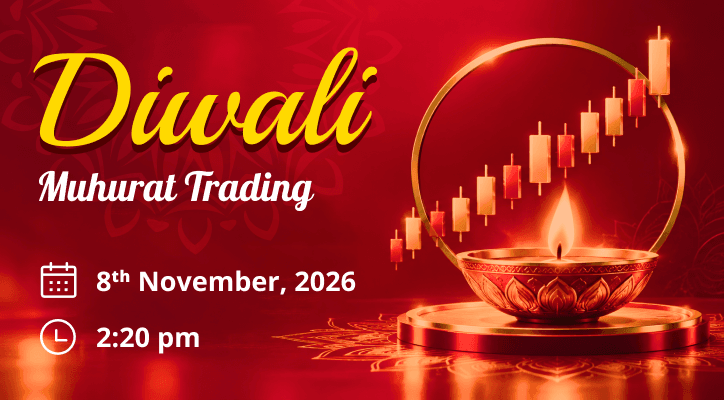
Muhurat Trading 2026: Will stock market be open on 8th November Sunday?
October 23, 2026 | 0 mins read
Muhurat Trading 2026 will be held on Sunday, 8 November 2026, on Diwali Laxmi Puja. NSE and BSE will open their equity markets for a special afternoon session, with continuous trading beginning at 2:20 pm IST. Trading in securities not covered by the Closing Auction Session (CAS) will continue until 3:30 pm, while continuous trading in CAS-eligible securities will end at 3:15 pm. For investors, Muhurat Trading combines a long-standing Diwali tradition with an opportunity to participate in the stock market. Here is a guide to the date, timings and session structure for 2026.
How stock market psychology influences investment decision-making
October 23, 2026 | 0 mins read
Stock market psychology refers to the collective emotions, sentiment, and behavioural biases that influence the buying and selling decisions of investors. Rather than relying on fundamental and technical analysis, investors may sometimes react based on emotions, which can influence market movements.