Bar Charts and Bar Chart Patterns
- Understanding bar charts in trading
- Identifying different types of bar chart patterns
- Applications of bar charts in technical analysis
Introduction to Bar Charts in Technical Analysis
Bar charts, also referred to as OHLC charts (Open, High, Low, Close), are essential tools used by technical analysts and traders across various financial markets. Alongside candlestick charts, they are among the most frequently used chart types on platforms like m.Stock.
Each bar on the chart represents price movement for a specific time frame and contains four data points:
High (top of the vertical line)
Low (bottom of the vertical line)
Open (horizontal tick on the left)
Close (horizontal tick on the right)
Bar length varies with market volatility. Longer bars reflect higher price fluctuation, while shorter bars indicate subdued market activity. Colors help visualise sentiment: green bars for bullish closes and red for bearish ones.
How to Read a Bar Chart
Bar charts are versatile and can be applied across multiple timeframes, from monthly and weekly intervals to intraday charts such as 10-minute, 3-minute, or even 1-minute charts.
The fundamental principle in reading a bar chart lies in comparing the current bar with the one that came before it. If the closing price of the current bar is higher than the previous one, it reflects bullish sentiment. If it closes lower, it points to bearish momentum.
Traders often use a series of bars to spot trends. When consecutive bars form higher highs and higher closes, it signals an uptrend or buying strength in the market. Conversely, lower lows combined with lower closes indicate a downtrend or increased selling pressure.

The length of the bar also communicates the level of market activity. Longer bars suggest heightened volatility and active participation, whether from buyers or sellers. When bars progressively increase in size, it typically reflects growing interest, buying or selling, depending on the trend direction. If bars begin to shrink, it may indicate weakening momentum or reduced enthusiasm in the current direction.

The closing price's location within the bar carries added meaning. A close near the top suggests buyers held control until the end of that timeframe, whereas a close near the bottom indicates seller dominance. A closing price around the mid-point can reflect indecision or profit-booking by traders.

Similarly, the opening price is significant. When a bar opens near the low and then closes higher, it implies bullish intent.
An open near the high followed by a lower close, leans bearish. If both the open and close are near the top, buyers are firmly in control. If both are located near the bottom, it shows sellers have the upper hand. When both values sit around the middle, it generally reflects a tug-of-war between buyers and sellers, without a decisive outcome.


Understanding these nuanced relationships between open, high, low, and close helps traders decode price action more precisely. On platforms like m.Stock, reading bar charts effectively can offer timely insights for short-term trades as well as long-term investment decisions.
Popular Bar Chart Patterns
Bar chart patterns are significant signals in a trader’s toolkit. These patterns reveal possible market direction and are generally more reliable over longer time frames.
1. Inside Bar
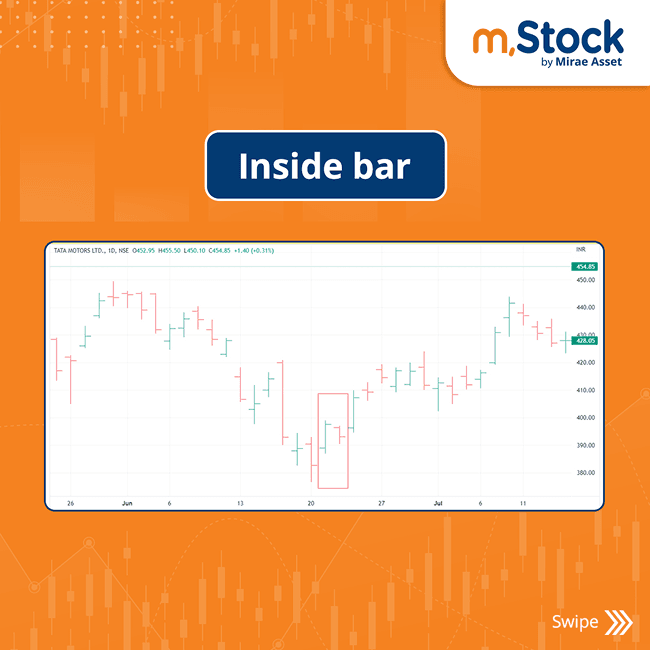
An inside bar is a two-bar pattern where the second bar’s high and low are contained within the first bar. It reflects decreased volatility and indecision. Directional trade is triggered when price breaks out of the second bar’s range:
Above high = bullish breakout
Below low = bearish breakout
Always use a strict stop-loss, as false breakouts are common.

2. Inside Body Narrow Range (NR4)
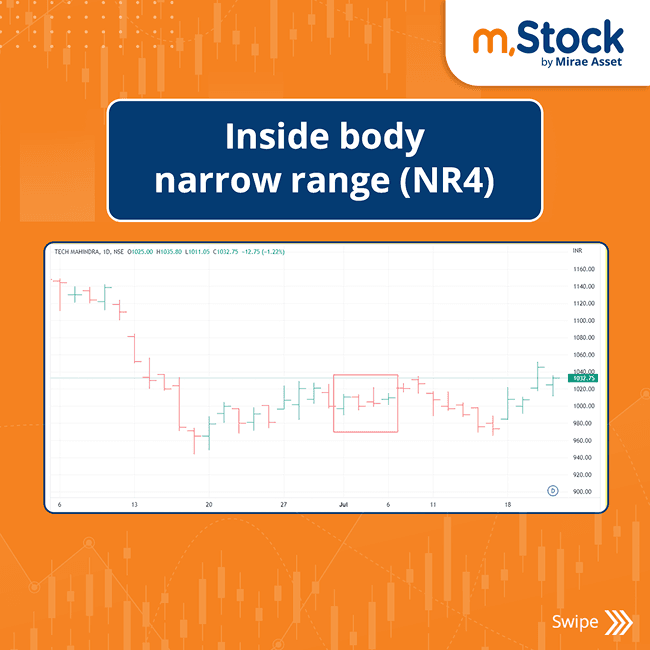
A variation of the inside bar, the NR4 pattern consists of four bars, with the last bar having the smallest range of high and low. It signals consolidation before a breakout. Entry is made above or below the narrowest bar’s range.

3. Outside Bar
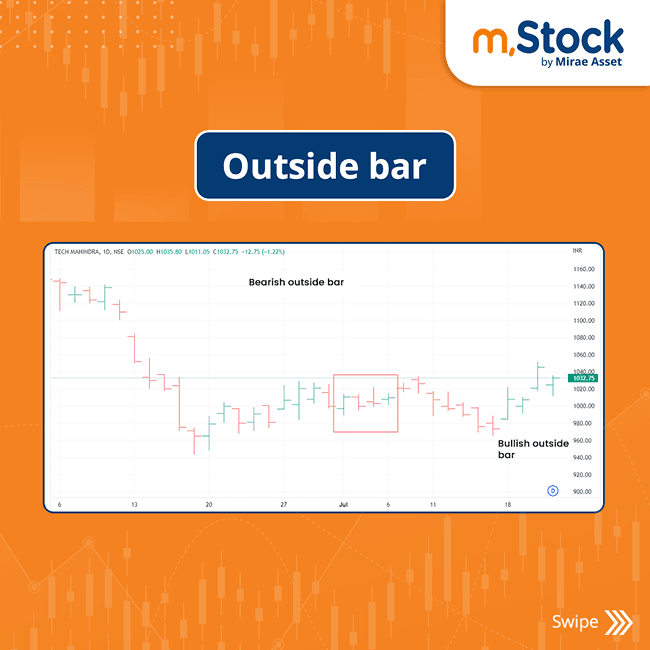
An outside bar engulfs the previous bar completely and acts as a reversal signal:
Bullish outside bar: After a downtrend, indicates upward reversal
Bearish outside bar: After an uptrend, signals potential drop
The key is a total engulfing of the prior bar’s range.

4. Two & Three Bar Reversal Patterns
Two-Bar Reversal:
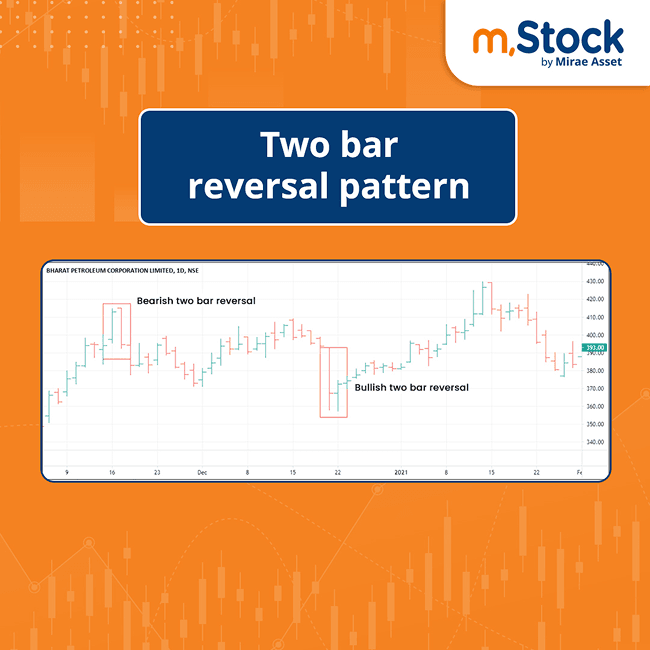
Bullish: Strong red bar followed by a strong green bar
Bearish: Strong green bar followed by a strong red bar
These typically occur near support/resistance zones after a pullback

Three-Bar Reversal:
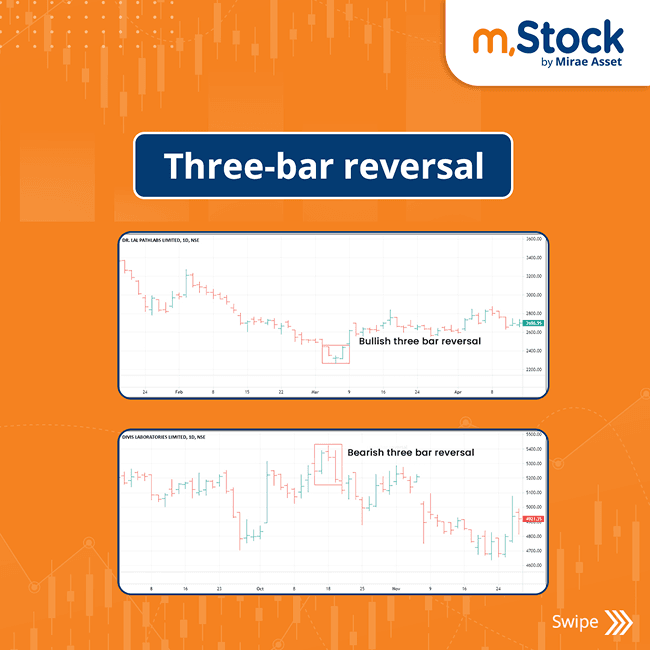
Bullish:
First: strong bearish bar
Second: small-bodied bar with lower close
Third: strong bullish bar closing above previous highs
It is similar to morning star in candlestick charts

Bearish:
First: strong bullish bar
Second: small-bodied bar with higher close
Third: strong bearish bar closing below prior lows
It is similar to evening star pattern

5. Exhaustion Bar
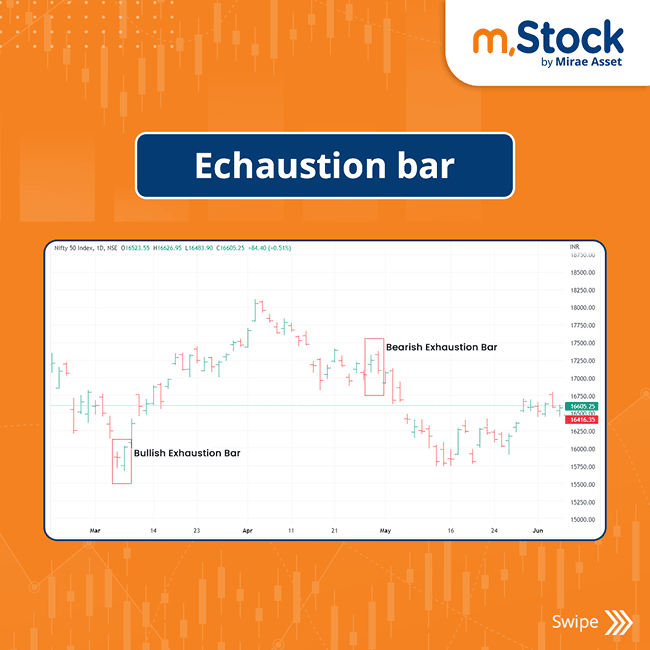
An exhaustion bar appears near the end of a trend and is marked by high momentum and a gap:
Bullish exhaustion:
Gap down
Followed by a strong rally with volume
Closes near the high
Bearish exhaustion:
Gap up
Followed by a sharp fall with volume
Closes near the low
These gaps remain unfilled, confirming the exhaustion.

6. Island Reversal
The island reversal is a rare but powerful pattern:
Bullish:
Gap down after a downtrend
Followed by a gap up with bullish bar
Bearish:
Gap up after an uptrend
Followed by a gap down with bearish bar
High volume during both gaps adds to its significance. It often traps traders on the wrong side of the trend.
