Gap Up and Gap Down in Price Charts
- What are gap up and gap down openings?
- Key factors influencing gaps in the stock market
- Types of gaps and their interpretation
- How to analyze gaps using technical indicators
Understanding Gap Up and Gap Down in Stock Prices
One of the fundamental truths in stock trading is that the opening price of a stock rarely matches its previous session’s closing price. This discrepancy often stems from events occurring after the market closes and before it reopens, both at a domestic and global level. Since Western markets remain active while Indian markets are shut, developments in the U.S. or European markets can heavily influence the opening prices in India.
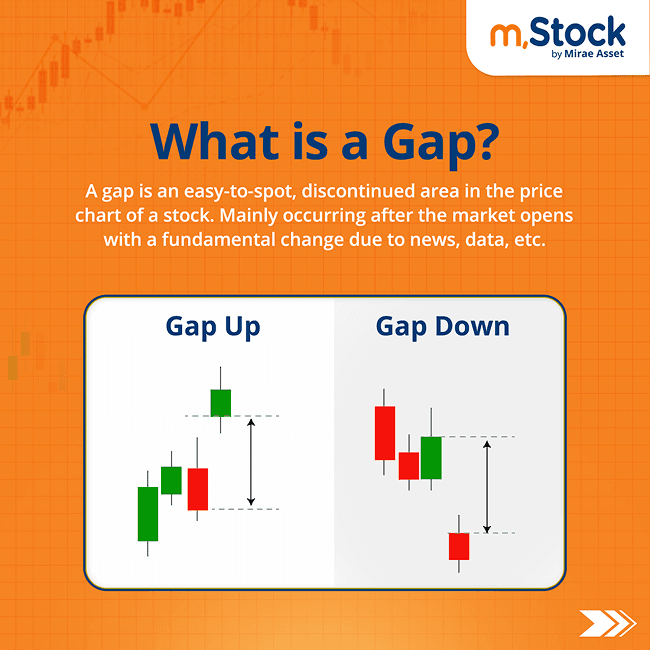
This difference between the previous day’s closing price and the current day’s opening price results in what traders call a gap up or gap down on the price chart. When the stock opens higher than the previous session’s high, it’s a gap up. Conversely, when the stock opens below the prior session’s low, it’s a gap down. The magnitude of these gaps may vary, and larger gaps often act as early signals for trend continuation or reversal.
Why Gaps Occur in Stock Charts
While gaps can appear across different timeframes daily, weekly, or monthly they are most prevalent on daily charts. Weekly gaps are common too, often influenced by developments over the weekend. Even monthly gaps are not unusual, especially when significant events like OPEC meetings or global economic policy changes occur.
Due to increasing global integration, any geopolitical or economic incident around the world can ripple across markets. For instance:
Indian stocks listed overseas may respond to international sentiment, affecting their opening price in India.
GIFT Nifty’s price action, which begins before Indian markets open, can forecast the Nifty’s opening direction.
Domestic factors such as quarterly results, policy changes, and unforeseen events (like natural disasters or conflicts) can also drive gap openings.
These interconnected influences make it vital for traders to understand and analyse gaps accurately.
Types of Gaps in Technical Analysis
Although gaps are visually easy to spot, interpreting their significance requires deeper analysis. There are four main types of gaps, each with a different implication:
1. Common Gaps
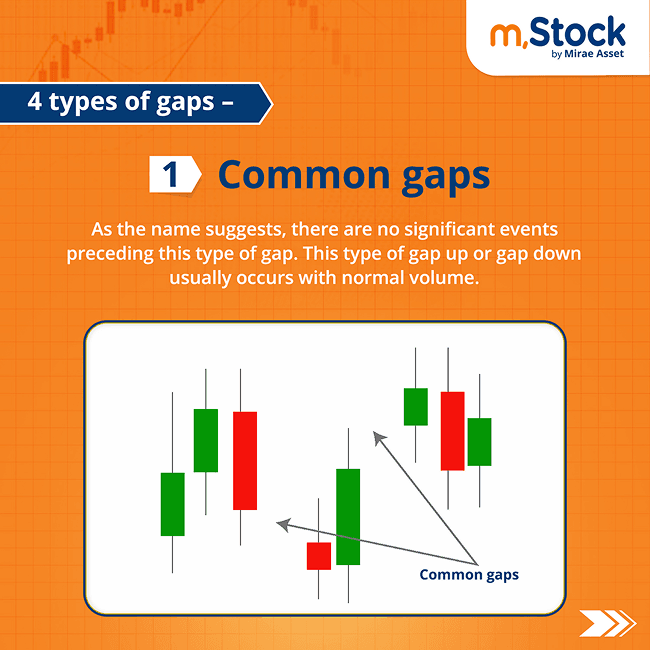
These are routine gaps that occur without any major cause. Common gaps are usually seen on intraday charts and are often "filled" during the same trading session. That means the price returns to the level where the gap occurred.
Intraday traders, especially those using m.Stock’s advanced trading tools, actively monitor pre-opening prices to capitalise on these quick price reversals. These gaps typically form in low-volume zones and present short-term trading opportunities, provided strict stop-losses are followed.
Example:
In a 5-minute chart of HDFC, a common gap up was closed within 30 minutes, something not visible on daily charts due to the quick fill.

2. Breakaway Gaps
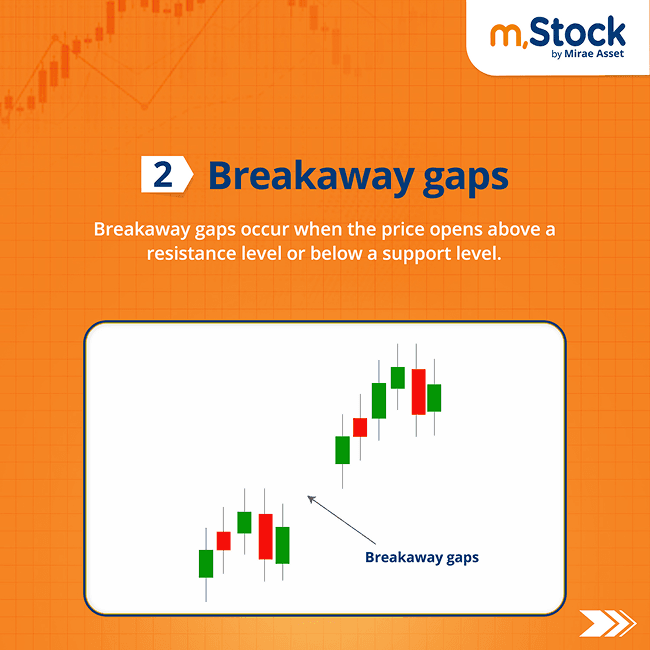
Breakaway gaps signify a price breakout from an established trendline, either upwards or downwards. These gaps don’t happen frequently and are generally backed by high volume a sign of increased participation and position shifts.
To identify these gaps, one must be proficient in trendline analysis. A true breakaway gap will show a spike in volume as traders exit losing positions and new players enter the market. These gaps may remain unfilled for a long period. However, if a breakaway gap gets filled quickly, it could indicate a failed breakout, prompting a strategy reversal.
Example:
In the daily Nifty chart, a clear breakaway gap formed when the price gapped out of a trendline, validating the breakout with rising volume.
Pro tip: When a breakaway gap aligns with patterns like ascending or descending triangle breakouts, its significance is even stronger.

3. Runaway Gaps
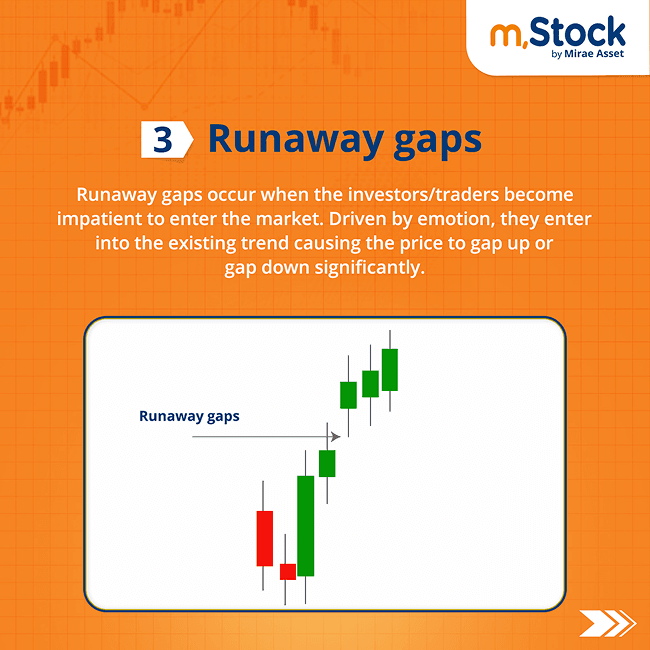
Also called measuring gaps, runaway gaps occur due to a sudden change in market sentiment. Triggers might include company acquisitions, resignations of top executives, major policy reforms, or a company winning a significant contract.
These gaps represent continued momentum, not the start of a new trend. On the downside, they may follow confirmation of bad news, leading to panic selling.
Like breakaway gaps, runaway gaps may not fill quickly, if at all.
Example:
The daily chart of Tata Steel shows a runaway gap followed by a strong downtrend, supported by increasing volume.

4. Exhaustion Gaps
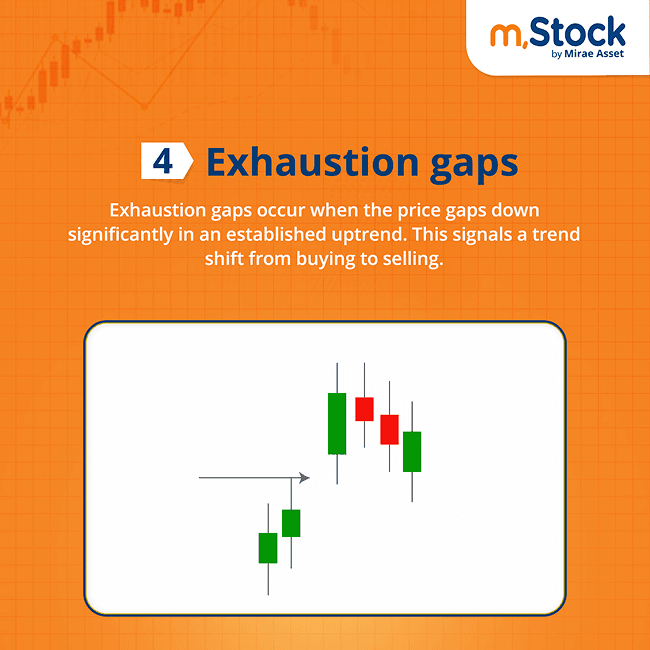
Exhaustion gaps appear near the end of an existing trend and often resemble runaway gaps at first glance. However, they are characterised by exceptionally high volume and tend to fill quickly.
These gaps indicate that the trend has run its course and that a reversal is likely. However, this can only be confirmed in hindsight, usually within the next one or two sessions.

Key difference: While breakaway and runaway gaps might remain open, exhaustion gaps tend to close shortly after forming.
Gaps as Support and Resistance
Gaps can also serve as critical support or resistance levels:
A gap up may act as support during a subsequent price correction.
A gap down may become resistance if the stock attempts to rally back.
Understanding where a gap occurred and the type of gap helps traders fine-tune their entry and exit strategies.
Points to Remember
A gap up or gap down happens when the opening price is higher or lower than the previous session’s close.
Breakaway gaps highlight potential trend reversals or beginnings of strong moves.
Runaway gaps signal continued momentum due to shifting market sentiment.
Exhaustion gaps suggest a trend is ending and often get filled quickly.
Gaps frequently act as strong support or resistance zones.