
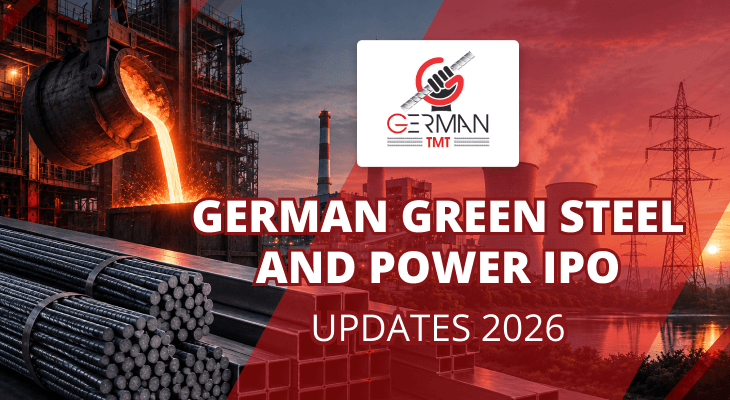
September 23, 2026 | 7 min read
German Green Steel and Power IPO: Everything You Need To Know About Dates, Price, Lot Size, Issue Details
German Green Steel and Power is a vertically integrated steel manufacturer focused on TMT bars. It operates facilities at Samakhiyali and Viramgam in Gujarat, with sponge iron, billet and rolling capacity supported by captive and renewable power. The financial trajectory is positive: FY26 revenue grew 11.4%, EBITDA margin expanded to 9.94% and PAT reached Rs 79.89 crore. The mix also shifted further towards TMT bars, which generated nearly 79% of FY26 revenue.
German Green Steel and Power IPO is principally a capacity-expansion raise. Most fresh proceeds are earmarked for new steelmaking, rolling, coating and hybrid power assets. That creates operating leverage potential, but also raises execution, utilisation and working-capital risk.
German Green Steel and Power IPO Dates And Launch Details
Event | Date |
|---|---|
IPO opens | 25 September 2026 |
IPO closes | 29 September 2026 |
Basis of allotment | 30 September 2026 |
Listing | 5 October 2026 |
German Green Steel and Power Price Band And Investment Details
Item | Detail |
|---|---|
Price band | Rs 132 to Rs 139 per share |
Face value | Rs 10 per share |
Minimum bid lot | 107 shares |
Minimum application at cap price | Rs 14,873 |
Listing exchanges |
IPO Structure
Component | Amount / shares | What it means |
|---|---|---|
Fresh issue | Up to Rs 290 crore | Cash goes to GGSPL |
Offer for sale | Up to 10,00,000 shares | Cash goes to promoter selling shareholders |
OFS value at cap price | Rs 13.90 crore | Does not fund the company |
Total offer at cap price | About Rs 303.90 crore | Fresh issue plus OFS |
Pre-IPO placement | Rs 49.63 crore at Rs 270 per share | Already reduced from fresh issue |
The OFS comprises 5,00,000 shares each from promoter selling shareholders Inamulhaq Shamsulhaq Iraki and Abdulhaq Shamsulhaq Iraki. At the cap price, the implied post-issue market capitalisation is approximately Rs 1,047 crore.
About The Company
Incorporated in 2008, GGSPL manufactures steel through two Gujarat facilities. Samakhiyali is vertically integrated from sponge iron to billets and TMT bars; Viramgam operates through material subsidiary German TMT Private Limited. The company markets TMT bars under the German TMT brand.
- Products: TMT bars in 8-40 mm sizes, MS billets, sponge iron and by-products; newer offerings include cut-and-bend and epoxy-coated bars.
- Customers: distributors, dealers and institutions across roadways, engineering, thermal power and real estate.
- Footprint: predominantly Gujarat, with limited FY26 exports to Cape Verde, Tanzania and Sri Lanka.
- Power: 20 MW captive coal and waste-heat capacity, plus operating and planned hybrid wind-solar assets.
- Sustainability credential: the company and material subsidiary received four-star and five-star Green Steel ratings, respectively.
Business Model And Revenue Mix
Product | FY24 share | FY25 share | FY26 share |
|---|---|---|---|
TMT bars | 63.13% | 66.49% | 78.74% |
MS billets | 15.49% | 7.44% | 6.02% |
Sponge iron | 2.70% | 2.05% | 1.85% |
Others / by-products | 18.67% | 24.02% | 13.38% |
Manufacturing Capacity And Utilisation
Product | Installed capacity FY26 | FY24 utilisation | FY25 utilisation | FY26 utilisation |
|---|---|---|---|---|
Sponge iron | 66,000 MT | 98.08% | 99.32% | 95.21% |
MS billets | 3,57,060 MT | 80.66% | 83.43% | 79.44% |
TMT bars | 3,01,950 MT | 75.29% | 72.19% | 87.79% |
TMT utilisation rose sharply in FY26, supporting the revenue mix improvement. Sponge iron capacity is already near full utilisation. The planned expansion therefore addresses a real operating constraint, although billet utilisation has room to improve within the existing base.
At Samakhiyali, the project is expected to take sponge-iron capacity from 66,000 MTPA to about 1,48,500 MTPA, billet capacity from 2,14,500 TPA to 4,12,500 TPA and TMT capacity from 1,81,500 MTPA to 3,46,500 MTPA. Commercial production is scheduled for December 2027.
Customer, Channel And Geographic Mix
Customer channel | FY24 share | FY25 share | FY26 share |
|---|---|---|---|
Distributors | 52.94% | 40.43% | 37.57% |
Dealers | 3.23% | 11.49% | 20.89% |
Institutional customers | 43.82% | 48.08% | 41.53% |
Dealer contribution has grown rapidly, broadening the route to market. Even so, the customer base remains concentrated: the largest customer contributed 10.67% of FY26 revenue and the top 10 contributed 50.62%. Most sales are based on periodic purchase orders rather than long-term contracts.
Financial Performance
Metric (Rs crore) | FY24 | FY25 | FY26 |
|---|---|---|---|
Revenue from operations | 1,129.78 | 1,507.57 | 1,678.98 |
EBITDA | 79.33 | 116.81 | 166.96 |
EBITDA margin | 7.02% | 7.75% | 9.94% |
PAT | 41.67 | 59.94 | 79.89 |
PAT margin | 3.69% | 3.98% | 4.76% |
FY24-FY26 revenue grew at about 21.9% CAGR, while PAT grew at about 38.4% CAGR. Margin expansion reflects the richer TMT mix, increasing integration and greater captive-power contribution. The fixed-asset turnover ratio nevertheless fell from 4.10x to 2.55x as capital expenditure ran ahead of revenue.
FY25 comparability also requires care because the group acquired and consolidated its material subsidiary. Part of the jump in assets and scale should therefore be distinguished from purely organic growth.
Balance Sheet And Returns
Metric | FY24 | FY25 | FY26 |
|---|---|---|---|
Net worth / total equity (Rs crore) | 176.06 | 293.91 | 423.70 |
Total borrowings (Rs crore) | 193.76 | 342.84 | 328.92 |
Debt-equity | 1.13x | 1.18x | 0.79x |
Finance cost (Rs crore) | 22.10 | 32.67 | 42.96 |
Current ratio | 1.06x | 1.03x | 0.97x |
Return on net worth | 23.67% | 20.40% | 18.86% |
ROCE | 18.62% | 15.91% | 19.31% |
Leverage improved in FY26 because equity grew faster than debt. However, finance costs continued to rise and year-end current liabilities slightly exceeded current assets. Only Rs 7.70 crore of IPO proceeds is earmarked for debt repayment, equal to a small portion of outstanding fund-based borrowings. This IPO is primarily an expansion raise, not a deleveraging event.
Cash Flow And Working Capital
Metric | FY24 | FY25 | FY26 |
|---|---|---|---|
Cash flow from operations (Rs crore) | 28.36 | 74.43 | 140.80 |
Free cash flow (Rs crore) | (49.33) | (171.77) | 7.62 |
Inventory days | 53.6 | 77.5 | 86.9 |
Receivable days | 28.5 | 36.3 | 35.5 |
Payable days | 42.7 | 83.0 | 95.2 |
Cash conversion cycle | 39.4 | 30.8 | 27.3 |
Where The Fresh Issue Money Goes
Samakhiyali expansion and hybrid power | Rs 226.33 crore | Capacity, product mix and energy-cost opportunity; high execution risk |
Debt repayment | Rs 7.70 crore | Modest reduction versus total borrowings |
General corporate purposes | Balance | Final amount depends on issue expenses and pricing |
The project includes a kiln, furnace, continuous casting, rolling and structural-section capacity, a shredder, epoxy/zinc coating and hybrid power. It is intended to add value-added products, reduce scrap dependence and lower grid-power reliance. Many equipment orders were not placed as of the RHP, so schedule and cost control are key.
Sector And Market Context
The RHP-commissioned CARE report states that India produced 169 million tonnes of crude steel in FY26 and consumed 164 million tonnes of finished steel. Domestic finished-steel consumption grew at an 11.6% CAGR from FY21 to FY26, supported by infrastructure, construction, railways and manufacturing.
Demand is projected to remain strong, but steel is cyclical. TMT prices react to raw-material costs, imports, construction activity, energy and freight. GGSPL's greater captive and renewable power share can reduce one source of volatility, but it cannot remove steel-price and demand cycles.
Strengths
- Vertical integration: Sponge iron, billets, TMT rolling and captive power provide more control over cost, quality and scheduling.
- Improving product mix: TMT bars rose to 78.74% of FY26 revenue.
- High utilisation: Sponge iron ran above 95% and TMT utilisation reached 87.79% in FY26.
- Better capital efficiency: ROCE recovered to 19.31% in FY26 as margins expanded.
- Power integration: Combined operations sourced 66.98% of FY26 consumption from captive and hybrid generation.
- Distribution depth: Dealer count grew to 148 and direct institutional customers to 343 by FY26.
Risks
Risk | Key Risk Indicators | What to monitor |
|---|---|---|
Customer concentration | Top 10 customers contributed 50.62% of FY26 revenue | Largest and top-10 share; repeat business |
Supplier and import exposure | Top 10 suppliers were 41.30% of purchases; much scrap is imported at spot prices | Scrap, coal, freight and currency costs |
Capex execution | Rs 226.33 crore project; orders were pending for some machinery | Commissioning by December 2027 and cost overruns |
Working capital | Inventory days rose to 86.9; current ratio fell below 1x | Inventory turns and supplier-credit dependence |
Cyclicality | TMT demand and spreads depend on construction, steel prices and imports | Realisation minus raw-material cost per tonne |
Customer contracts | Sales are usually based on periodic purchase orders | Order visibility and dealer throughput |
Brand / IP | German TMT is licensed; past TMX/Thermex notices required corrective action | Licence continuity and legal disputes |
Environmental compliance | Steelmaking is emissions- and power-intensive | Approvals, green-power share and compliance capex |
Opportunities
- Capacity-led growth: New sponge iron, billet and rolling capacity can support volumes once commissioned and utilised.
- Higher-value products: Coated bars, cut-and-bend products and structural sections can improve mix and customer reach.
- Contract manufacturing: The agreement with JSW One Distribution can support utilisation, standards and brand visibility.
- Geographic expansion: The company intends to deepen Gujarat coverage and enter neighbouring markets including Madhya Pradesh.
- Energy savings: Additional wind, solar and waste-heat use can reduce grid exposure and operating cost.
- Lower scrap dependence: More sponge-iron capacity and shredding may reduce reliance on imported scrap.
Valuation Lens
At Rs 139, the implied post-issue market capitalisation is approximately Rs 1,047 crore. This is about 13.1 times FY26 PAT and 0.62 times FY26 revenue. Using FY26 borrowings and cash as a simple reference gives an indicative enterprise value of roughly 8.2 times FY26 EBITDA, before adjusting for fresh-issue cash and its deployment.
These multiples capture current earnings, while most IPO money will fund assets that are scheduled to enter commercial production only in December 2027. The relevant valuation question is therefore whether the project can preserve ROCE near or above FY26 levels after the asset base expands.
What To Track After Listing
- Project ordering, capex spend, commissioning and commercial production against the December 2027 schedule.
- TMT, billet and sponge-iron utilisation after the expansion.
- Revenue and EBITDA generated per rupee of new fixed assets.
- Inventory days, payable days, current ratio and operating cash flow.
- Debt, finance cost and whether leverage falls despite the capex programme.
- TMT share of revenue and contribution from coated / value-added products.
- Top-customer and top-supplier concentration.
- Captive and renewable share of power consumption.
Conclusion
GGSPL has improved scale, margins, cash generation and ROCE while shifting towards finished TMT products. Its integrated manufacturing base and rising captive-power contribution provide a credible route to better operating economics.
The IPO also begins a demanding phase. The company must execute a large expansion, fill new capacity, control inventory and protect margins through a steel cycle. The post-listing scorecard should centre on asset productivity and cash conversion, not only revenue growth.
More Related Articles
Orient Cables (India) IPO
 September 23, 2026 | 0 mins read
Orient Cables manufactures networking cables, specialty power and optical fibre cables, cable assemblies and passive networking products. It supplies telecom, broadband, data-centre, renewable-energy, FMEG and automotive customers from three facilities in Bhiwadi and Bengaluru. FY26 revenue grew 42.0% to Rs 1,171.65 crore, led by a 155.3% increase in specialty power and optical fibre cable sales. Profit, however, was almost flat at Rs 53.81 crore because material, employee, depreciation and finance costs rose with the expansion. Oriebt Cables IPO combines of Rs 320 crore fresh issue with a Rs 232 crore offer for sale. The fresh capital will fund machinery, debt repayment and general corporate purposes. The central question is whether rapid growth can begin generating cash rather than requiring progressively more working capital and borrowing.
Varmora Granito Ltd IPO Day 2 Subscription Status
September 23, 2026 | 0 mins read
Varmora Granito Ltd is launching its IPO on 22 Sep 26. Check here the Day 2 IPO subscription status on m.Stock.
Armee Infotech Ltd IPO Day 1 Subscription Status
September 23, 2026 | 0 mins read
Armee Infotech Ltd is launching its IPO on 23 Sep 26. Check here the Day 1 IPO subscription status on m.Stock.