What Are Trendlines?
- Learn the role of trendlines in technical analysis
- How to draw and identify trendlines accurately
- Understand various types of trendlines and what they indicate
- Analyse how support and resistance levels are breached using trendlines
As we wrap up Module 4, let’s explore trendlines—a fundamental yet powerful tool in technical analysis, widely used to decode price action. In essence, trendlines are diagonal lines drawn between key swing points (major highs or lows) to determine the prevailing trend of a stock or market. These points serve as dynamic support and resistance zones.
Unlike static horizontal levels, trendlines slope, either upward or downward, signalling the market’s directional bias.
Upward sloping trendlines reflect rising demand and potentially higher prices
Downward sloping trendlines indicate increasing supply and potential price declines
How to Draw Trendlines
A minimum of two swing highs or lows is essential to draw a trendline
Uptrend line: Connects two or more swing lows, indicating support
Downtrend line: Connects two or more swing highs, signalling resistance
Start by locating a significant high or low, then link it to the next logical swing point
A trendline with three or more touchpoints gains strength and credibility
If a line has five or more touches, the probability of a breakout increases
Candlestick overlaps are acceptable, but the line must not cut through the candle body
Angles of Trendlines
The angle of a trendline reflects the strength of a trend. Commonly, traders prefer angles between 30° to 45° for balanced trend analysis.
Steeper uptrend lines (more than 45°) suggest strong buying interest
Gentler slopes may indicate weaker demand
Similarly, steep downward lines suggest intense selling pressure
Angles help gauge the momentum behind price movements
Trendline Sloping Up & Down


Visualizing trendlines sloping upward or downward gives clear insight into market direction.
An upward trendline marks area where demand consistently steps in
A downward trendline highlights zones where supply repeatedly dominates
Timeframes for Drawing Trendlines
Always begin with higher timeframes (daily, weekly) when plotting trendlines
Trendlines drawn on higher timeframes carry more weight and visibility
Once established, these lines act as strong support/resistance across lower timeframes
This enhances their predictive and trading value
Trading the Trendlines
Trading using trendlines can be categorized into breakouts and bounces.
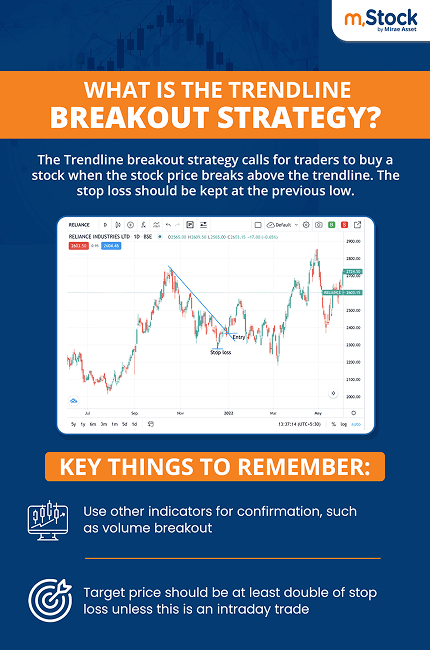
1. Trendline Breakouts
A breakout occurs when the price moves beyond the trendline, either upward or downward.
In an uptrend, a breakout happens below the trendline
In a downtrend, a breakout occurs above the trendline
A short-term counter-trendline may emerge within the main trend during a retracement, providing breakout opportunities in the direction of the original trend
Example:
In an uptrend, trendlines are drawn using swing lows
During a pullback, another line is drawn across lower highs. If the price breaks above this inner line, it may resume the uptrend
In a downtrend, the trendline joins swing highs
During a bounce, a short-term line across swing lows can serve as a breakout trigger in favor of the prevailing downtrend
2. Trendline Bounces
A bounce happens when the price touches the trendline and rebounds in the direction of the trend.
In an uptrend, price may retrace to the trendline and bounce upward, indicating renewed buying
In a downtrend, price may rise toward the trendline and then bounce lower, signalling renewed selling
Bonus insight:
A break and retest of a trendline can offer high-probability trade setups when supported by other confirmation tools.
Combining Trendlines with Indicators
While trendlines are standalone tools, their accuracy improves when combined with other indicators or chart patterns. Some effective combinations include:
Candlestick patterns (e.g., pin bars, bullish/bearish engulfing)
Moving averages that align with the trendline
Fibonacci retracement levels for confirming bounce zones
Momentum indicators to validate trend strength
Example:
A pin bar or bullish engulfing pattern near a trendline support adds conviction to a buy trade. Similarly, if a Fibonacci level overlaps the trendline, it becomes a strong confluence zone.
Points to Remember
Trendlines are essential tools for spotting trend direction and trade opportunities
No fixed rule defines the "correct" way to draw a trendline—some use wicks, others use closing prices
Ensure sufficient touchpoints for the trendline to be valid
Avoid force-fitting trendlines to suit your bias. Objectivity is key
Always trade with a well-defined stop loss to manage risk