
August 19, 2026 | 12 min read
How to Identify False Breakouts (fakeouts) in Options Trading?
In trading, not every breakout leads to a strong trend. Sometimes, the price briefly moves above resistance or below support, attracts traders into new positions, and then quickly reverses direction. This phenomenon is known as a false breakout or fakeout. For options traders, recognising fake breakouts can be especially important because option premiums are sensitive to both price movement and time decay. Entering a trade on a false signal can lead to rapid losses, while identifying a fakeout early may create profitable trading opportunities.
What Is a False Breakout in Trading?
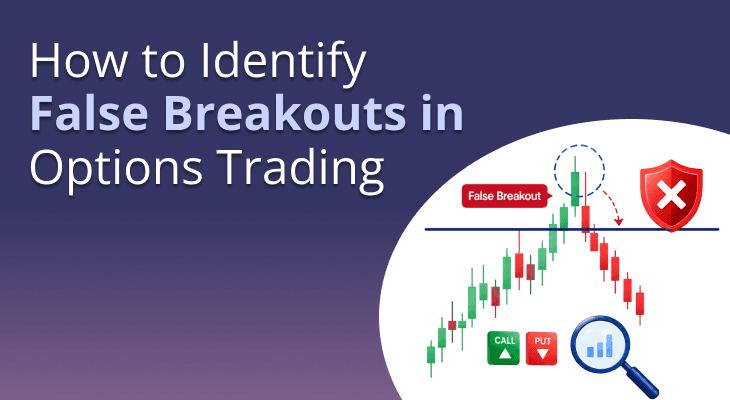
A false breakout, commonly known as a fakeout, occurs when the price moves beyond a key support, resistance, trendline, or chart pattern but fails to continue in that direction. Instead of developing into a new trend, the price quickly reverses and moves back within the original trading range.
In simple terms, the market creates the impression of a breakout, attracts traders into fresh positions, and then turns in the opposite direction. This is why fake breakouts are often referred to as trader traps.
For options traders, false breakouts can be particularly damaging because option premiums can lose value rapidly when the underlying asset reverses direction. Apart from the price movement, factors such as time decay and changes in implied volatility may further impact the trade.
Key Characteristics of a False Breakout
- Price briefly moves above resistance or below support
- The breakout lacks strong follow-through
- Trading volume remains weak or inconsistent
- Price closes back inside the previous range
- Breakout traders become trapped as the market reverses
How Fake Breakouts Work in Options Trading?
In options trading, a breakout above resistance or below support often attracts traders looking for a strong directional move. However, some breakouts fail to sustain momentum and quickly reverse, creating fake breakouts that can trap market participants. Here are the key stages that explain how fakeouts typically develop in the options market.
1. Price Breaks a Key Level
The process usually starts when the underlying stock or index moves above a resistance level or below a support level. This breakout attracts attention because traders interpret it as the beginning of a new trend.
For example:
- Nifty breaks above a major resistance zone
- A stock moves above its recent swing high
- Price escapes from a consolidation pattern
At this stage, many traders prepare to enter directional trades.
2. Traders Rush Into Options Positions
Once the breakout becomes visible, traders often buy call options during bullish breakouts and put options during bearish breakouts.
This sudden participation can lead to:
- Increased trading activity
- Rising option premiums
- Higher implied volatility
- Strong short-term momentum
The breakout initially appears genuine, encouraging more traders to join the move.
3. Smart Money Collects Liquidity
Support and resistance levels often contain stop-loss orders, pending buy orders, and pending sell orders. Large market participants may push prices beyond these levels to trigger those orders and access liquidity.
As a result:
- Breakout traders enter new positions
- Existing traders get stopped out
- Institutional participants gain liquidity for larger trades
This phase is often referred to as a liquidity sweep.
4. The Breakout Fails to Attract Follow-Through Buying or Selling
A genuine breakout typically receives continued support from market participants. In a fake breakout, however, the buying or selling pressure quickly fades.
Common warning signs include:
- Low volume after the breakout
- Weak candle closes
- Lack of Open Interest buildup
- Immediate rejection from higher or lower levels
Without sustained participation, the breakout begins to weaken.
5. Price Moves Back Into the Original Range
Once the breakout loses momentum, the price starts reversing towards the previous support or resistance zone. This is the point where the breakout officially becomes a fakeout.
The market may:
- Close back inside the range
- Break below the breakout candle
- Form rejection candlesticks
- Trigger stop-losses of breakout traders
6. Option Premiums Start Losing Value
For options traders, the damage can be greater than in cash-market trading because option prices depend on multiple factors.
As the underlying asset reverses:
- Option premiums decline
- Time decay continues to erode value
- Implied volatility may contract
- Traders face losses even if the reversal is small
This is why fake breakouts can be particularly costly in options trading.
7. Reversal Traders Enter the Market
Experienced traders often wait for confirmation that a breakout has failed before entering a trade. Once the fakeout becomes evident, they may trade in the opposite direction.
For example:
- A failed bullish breakout may lead traders to buy put options
- A failed bearish breakout may encourage traders to buy call options
These reversal trades attempt to capture the move back towards the previous trading range.
Common Fake Breakout Patterns Traders Should Know
Not all false breakouts look the same on a chart. Some occur around support and resistance levels, while others develop within chart patterns such as triangles, ranges, or channels. Learning to recognise these fake breakout patterns can help you avoid entering trades at the wrong time and identify potential reversal opportunities.
1. Bull Trap
A bull trap occurs when the price breaks above a resistance level and appears ready to continue higher. Many traders enter long positions or buy call options, expecting further upside. However, the buying momentum quickly fades, and the price falls back below resistance.
Key signs:
- Breakout above resistance
- Weak volume confirmation
- Long upper-wick candles
- Price closes back below the breakout level
2. Bear Trap
A bear trap is the opposite of a bull trap. The price falls below a key support level, encouraging traders to sell or buy put options. Instead of continuing lower, the market reverses sharply and moves back above support.
Key signs:
- Breakdown below support
- Limited follow-through selling
- Strong recovery candle
- Price re-enters the previous range
3. Range Breakout Failure
Markets often move sideways between a defined support and resistance zone. A breakout from this range may initially appear strong. However, if buyers or sellers fail to maintain momentum, the price can quickly return to the range.
Key signs:
- Temporary move outside the range
- Lack of sustained volume
- Failed retest of the breakout level
- Return to consolidation
4. Triangle Breakout Failure
Triangle patterns are popular among traders because they often signal a potential breakout. However, a breakout from a symmetrical, ascending, or descending triangle can fail if market participation remains weak.
Key signs:
- Breakout from the triangle boundary
- Low trading volume
- Quick reversal into the pattern
- No follow-through momentum
5. Trendline Fakeout
Price may break a well-established trendline, leading traders to believe that the trend has changed. If the breakout lacks strength, the market may return above or below the trendline and continue in the original direction.
Key signs:
- Brief break of the trendline
- Weak confirmation candles
- Price quickly regains the trendline
- Original trend resumes
6. Previous High or Low Sweep
This pattern occurs when the market briefly moves above a previous swing high or below a previous swing low, triggering stop-losses and breakout entries before reversing.
Key signs:
- Price takes out a recent high or low
- Sudden rejection from that level
- Increase in volatility
- Strong reversal candle
How to Identify Fake Breakout Patterns on Charts?
Identifying fake breakout patterns does not require dozens of indicators. In most cases, a few key factors can help you determine whether a breakout is genuine or likely to fail.
1. Check Volume During the Breakout
A strong breakout is usually supported by higher-than-average volume. If the price moves beyond support or resistance on weak volume, the breakout may lack conviction and could reverse.
2. Wait for the Candle Close
Avoid entering a trade simply because the price briefly crosses a key level. A breakout that closes back inside the previous range is often an early sign of a fakeout.
3. Look for Rejection Candles
Candles with long upper or lower wicks near support or resistance can indicate that the market has rejected the breakout level.
- Long upper wick = Potential bull trap
- Long lower wick = Potential bear trap
4. Monitor Open Interest (OI)
For options traders, Open Interest can provide valuable confirmation. A breakout supported by rising OI is generally stronger than one with little or no OI participation.
5. Confirm with Higher Timeframes
A breakout on a 5-minute chart may fail if the daily or hourly trend does not support it. Checking higher timeframes can help filter out weaker signals.
Top Indicators to Detect Fake Breakouts Early
No indicator can identify every false breakout, but certain tools can help you assess whether a breakout has enough strength to continue. Instead of relying on a single signal, many traders use a combination of indicators to confirm price action.
1. Volume Indicator
Volume is often the first indicator traders check when analysing a breakout. A genuine breakout is usually accompanied by strong trading activity, while a breakout on weak volume may struggle to sustain momentum.
2. Relative Strength Index (RSI)
RSI helps measure momentum. If the price makes a new high but RSI fails to do the same, it may indicate weakening momentum and a higher chance of a fake breakout.
3. Open Interest (OI)
For options traders, Open Interest can provide valuable confirmation. A breakout supported by rising OI often suggests fresh participation, whereas weak OI growth may indicate that the move lacks conviction.
4. VWAP (Volume Weighted Average Price)
VWAP is commonly used to track institutional activity. If the price breaks out but quickly moves back below VWAP, it can signal that the breakout is losing strength.
5. Moving Averages
Popular moving averages such as the 20-day, 50-day, or 200-day moving average can help confirm trend direction. A breakout that fails to stay above a key moving average may have a higher probability of reversing.
Fake Out Trading Strategies for Options Traders
Trading fake breakouts is less about predicting reversals and more about waiting for confirmation that the breakout has failed. Once the market shows signs of rejection, traders can look for opportunities in the opposite direction.
1. Trade the Failed Breakout Reversal
One of the most common fake out trading approaches is to wait for the price to break a key level and then move back inside the range.
- Buy put options after a failed bullish breakout
- Buy call options after a failed bearish breakout
This strategy aims to capture the reversal after trapped traders begin exiting their positions.
2. Use Volume Confirmation
A breakout without strong volume is more likely to fail. If the price crosses resistance or support but volume remains weak, wait for confirmation before entering a trade.
Many traders use low-volume breakouts as an early warning sign of potential fakeouts.
3. Combine Price Action with Open Interest
For options traders, Open Interest can provide additional confirmation.
- Rising price with rising OI may indicate a stronger move
- Rising price with weak OI may indicate a temporary breakout
Using price action and OI together can help filter out weak setups.
4. Wait for a Retest of the Breakout Level
Instead of entering immediately, wait for the market to retest the breakout zone.
If the price fails to hold above resistance or below support during the retest, it can strengthen the case for a fake breakout trade.
5. Use Strict Risk Management
Not every fakeout leads to a strong reversal. Always place a stop-loss beyond the fakeout candle and define your risk before entering the trade.
Step-by-Step Process to Trade Fake Breakouts
Trading fake breakouts requires patience and confirmation. Instead of reacting to every breakout, focus on identifying signs that the move is failing before taking a position.
Step 1: Identify Key Support and Resistance Levels
Mark important price zones where breakouts are likely to occur. These levels often attract high trading activity and can become areas where fakeouts develop.
Step 2: Wait for the Breakout Attempt
Allow the price to move above resistance or below support. Avoid entering immediately, as many false breakouts occur during the initial move.
Step 3: Look for Signs of Weakness
Check whether the breakout is supported by strong volume, rising Open Interest, and convincing candle closes. Weak participation can indicate a potential fakeout.
Step 4: Wait for Confirmation of the Reversal
A breakout that moves back inside the previous range or forms a rejection candle may signal that the breakout has failed. This confirmation helps reduce the risk of entering too early.
Step 5: Enter the Trade With a Defined Stop-Loss
Once the fakeout is confirmed, consider taking a position in the opposite direction of the failed breakout. Place a stop-loss beyond the fakeout candle to manage risk.
Step 6: Monitor the Trade and Book Profits Systematically
Track price action as the market moves back towards support, resistance, or the middle of the previous range. Review the trade regularly and follow your exit plan rather than making emotional decisions.
What are the Best Market Conditions for Fakeout Trading?
Fake out trading tends to work better in markets where prices are moving within a range rather than following a strong trend. In these conditions, breakouts often struggle to sustain momentum and are more likely to reverse.
1. Range-Bound Markets
When prices repeatedly move between support and resistance, breakout attempts frequently fail because buyers and sellers remain balanced. This creates favourable conditions for spotting fakeouts.
2. Consolidation Phases
Periods of consolidation often produce multiple breakout attempts before a clear trend emerges. Traders who wait for confirmation can identify failed breakouts more effectively during these phases.
3. Expiry Week Volatility
In options markets, expiry week can bring sudden price swings and liquidity-driven moves. Some breakouts may occur only to reverse quickly as traders adjust positions and option writers defend key levels.
4. Low-Volume Trading Sessions
Breakouts that occur during low-volume periods are generally less reliable. Without strong participation, prices may struggle to maintain momentum and can return to their original range.
Real Examples of Fake Breakouts in Options Trading
Understanding how fake breakouts appear in actual trading situations can help you recognise them more quickly on live charts. While every market setup is different, the following examples illustrate how traders can get trapped when a breakout fails.
Example 1: Bull Trap Above Resistance
Suppose a stock has been facing resistance near ₹2,000 for several sessions. The price finally breaks above this level, prompting traders to buy call options in anticipation of a rally. However, the breakout is accompanied by weak volume and limited Open Interest buildup. Within a few hours, the stock falls back below ₹2,000 and closes inside the previous range.
What happened?
- Resistance was breached temporarily
- Breakout buyers entered aggressively
- Follow-through buying was missing
- Call option premiums lost value as the stock reversed
This is a classic bull trap and one of the most common fake breakout patterns.
Example 2: Bear Trap Below Support
Consider an index trading near a major support zone. When the price breaks below support, many traders buy put options expecting further downside. Soon after, selling pressure weakens, and buyers step in. The index recovers above support and continues moving higher.
What happened?
- The breakdown attracted bearish traders
- Support failed only briefly
- Short sellers and put buyers got trapped
- The reversal caused put premiums to decline
This is known as a bear trap.
More Related Articles

SEBI Proposes CAS Changes: What Could Change for Derivatives Settlement, IEPs & Timings?
 September 17, 2026 | 0 mins read
A month after introducing the new Closing Auction Session, SEBI has proposed changes after early market feedback raised concerns about derivatives settlement on expiry days, changing auction prices and trading timings. SEBI is not scraping CAS. Instead, it wants to make expiry settlement clearer, improve the auction process and help traders understand that indicative auction prices are not the same as actual traded prices.

ETF trading rules from 7 September: What changes for retail investors?
September 7, 2026 | 0 mins read
If there was no trade during the final 30 minutes on the previous day, the exchange will use that day’s last traded price. If there was no trade at all on the previous day, the latest available closing NAV will be used. The base price will also be adjusted for corporate actions, if applicable. From April 1, 2027, SEBI expects stock exchanges and mutual fund AMCs to use the previous day’s closing NAV as the base price after resolving operational issues.

How MSCI rebalancing tested India's Closing Auction System on August 31
September 2, 2026 | 0 mins read
India’s new Closing Auction Session (CAS) processed a record ₹39,718 crore turnover, on 31 August 2026 as MSCI India Index latest index rebalancing took effect at the market close. The event showed that CAS could handle an exceptional concentration of institutional flow. However, there were some sharp, and sometimes counterintuitive, stock moves. This shows that the quality of closing-price discovery is still being tested.
FAQ
No single indicator works perfectly. Many traders combine volume analysis, RSI divergence, moving averages, and price action confirmation. Volume is often considered one of the most useful indicators for confirming a breakout. Genuine breakouts usually attract strong trading participation, whereas fakeouts often occur on weak or declining volume.