Support and Resistance in Charts
- Understanding what support and resistance (S/R) levels are
- How historical price action shapes support and resistance zones
- Methods to chart support and resistance on price graphs
- How support and resistance levels are eventually breached
The human brain stands out for its ability to remember the past and anticipate the future. This innate tendency to recognize patterns and act on memory lies at the heart of many principles in technical analysis. One such concept is support and resistance. Traders across generations have observed that price levels which have held importance in the past often influence decisions in the future. The philosophy that history tends to repeat itself is a driving force behind the development and popularity of support and resistance analysis in markets.
What Is Support?
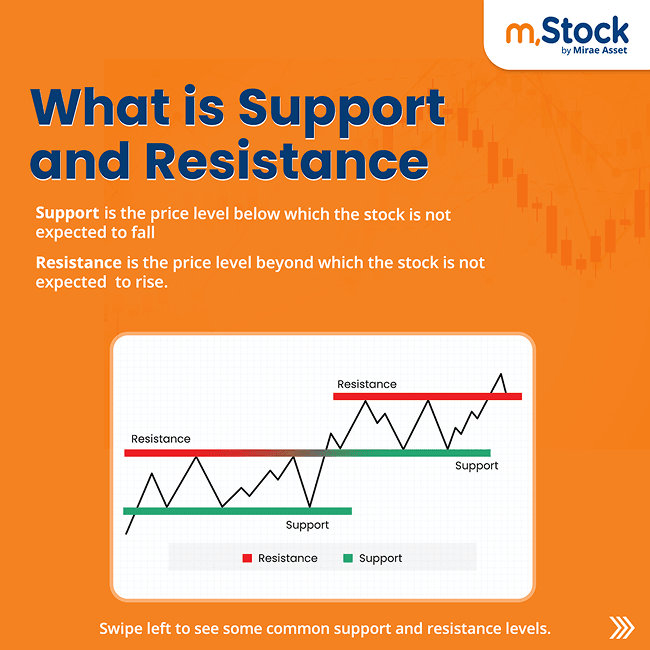
Support refers to a price level where a stock, after a decline, finds a zone that prevents further fall (at least temporarily). At this level, buying interest emerges, either causing a bounce back or leading to sideways movement. Support becomes relevant when the stock is in a downtrend. It reflects a zone where demand outpaces supply, offering a cushion to the price.
What Is Resistance?
Resistance is the opposite. It is a price level where an upward-trending stock struggles to move higher. At this point, sellers overpower buyers, leading to a pause in the rally or a downward reversal. Resistance is significant when the stock price is climbing. It acts as a ceiling that stalls upward momentum, at least until market sentiment shifts.
A Fascinating Twist
One of the most interesting aspects of support and resistance levels is how they interchange roles. When a stock breaks below its support and continues to fall, that broken support often becomes a new resistance level if the stock later attempts to rise. Similarly, if a resistance level is breached on the upside, it frequently acts as a new support zone during price corrections. This flip is a direct result of how market participants remember those levels and react when prices revisit them.
Key Insights About Support and Resistance
Support and resistance are flexible concepts and apply to all chart timeframes, whether it is intraday, daily, weekly, or monthly. These levels are not exact numbers but are best considered as zones or bands where price reacts. Because of the subjectivity involved, price may not reverse precisely at these levels.
Instead, traders often observe a price range where the reversal or reaction occurs. The more times a stock touches a support or resistance level without breaking it, the weaker that level becomes over time. Eventually, persistent testing leads to a breakout or breakdown.
Trendlines as Support and Resistance
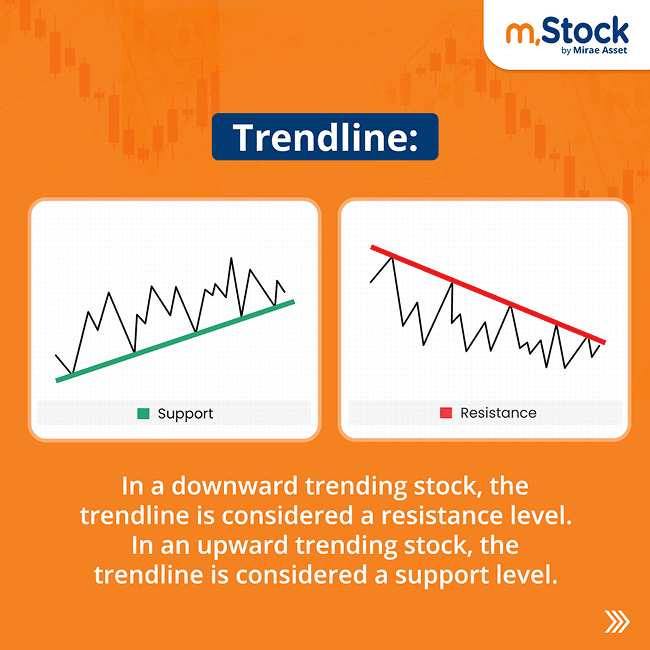
Trendlines are one of the simplest yet powerful tools for identifying dynamic support and resistance. A trendline connects consecutive highs (in a downtrend) or lows (in an uptrend) to depict the direction of the price movement.
When drawn correctly, they not only indicate trend direction but also act as levels where price tends to bounce or stall. A trendline drawn during a sustained rally connects the troughs, and during a decline, it connects the peaks. However, this method works effectively only when the market is trending. In sideways markets, trendlines offer limited insight.

A case in point is the price chart of Hindustan Unilever, where a long-term trendline acted as support for years before finally breaking in 2021. After the breakdown, the same trendline began acting as resistance. It’s important to remember that momentary intraday spikes above or below these lines do not necessarily count as valid breakouts or breakdowns.
Previous Highs and Lows as Resistance and Support
Historical highs and lows often influence market behavior because they remain etched in traders’ minds. A past peak often becomes a resistance level, and a past low frequently acts as support. This is due to the psychological influence of these levels—traders expect similar reactions when the price returns to these zones. Many short-term and long-term decisions are based on whether the stock approaches or breaches these historical benchmarks.
For example, in the Nifty Bank chart, previous highs transformed into support zones once breached. This interplay reinforces how powerful past price memories are in shaping market decisions.

IPO Issue Price as Support Level
In the case of newly listed stocks, the IPO issue price can also act as a psychological support or resistance level. If a stock lists below the offer price, that level becomes a resistance until the stock climbs above it.
On the other hand, if the stock corrects post-listing, the issue price may act as a cushion, offering support. This happens partly due to market makers or promoters trying to maintain price credibility and partly due to trader psychology.

Take UTI Asset Management Company for example. It got listed below its IPO price of ₹554. But once the price approached that level, it hovered around it for months, treating it as a crucial support zone. This shows how IPO pricing can influence chart behaviour, especially in the early phases of listing.
Moving Averages as Support and Resistance

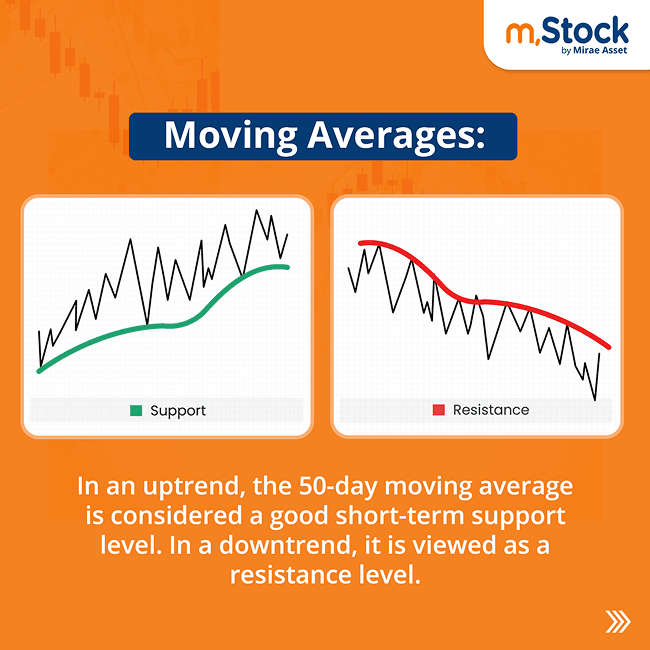
Moving averages, simple or exponential, are a favourite among both traders and investors for identifying trends, but they also serve as support and resistance levels. Being based on average closing prices over a set period (like 8-day, 21-day, 50-day, or 200-day), they help smooth out price action and provide reference points.

In Hero MotoCorp’s chart, the 200-day moving average has repeatedly acted as a resistance level. The price has struggled to cross and hold above it. Even when price pierced through temporarily, it eventually slid back below, reaffirming the average as resistance. Conversely, at times the same moving average offered strong support before it was finally breached. Once broken, the support line turned into resistance, yet another example of role reversal.

Short-term traders prefer shorter moving averages, while long-term investors rely on longer ones. Regardless of the time horizon, these averages frequently influence decision-making due to their widespread use.
Round Numbers as Psychological Barriers
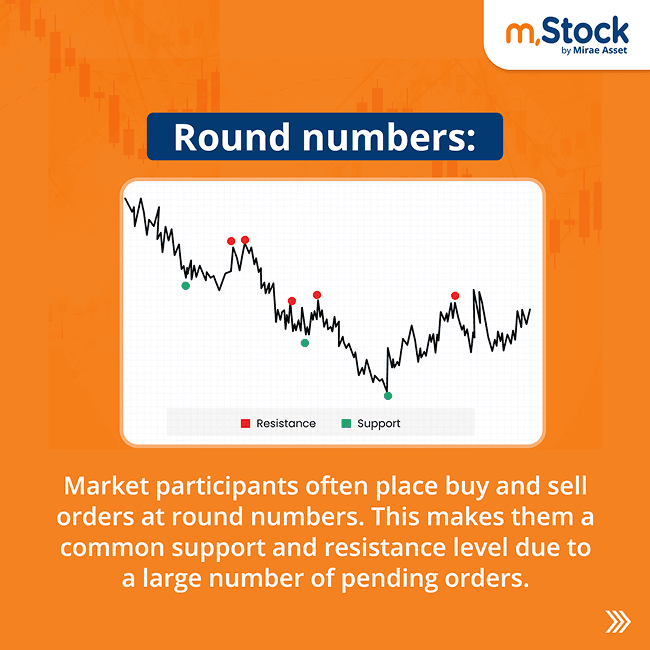
Just like a cricketer may feel pressure approaching a century, stock prices often face psychological resistance near round numbers like ₹100, ₹500, or ₹1,000. These levels often act as invisible hurdles, not because of any technical reason, but purely due to human psychology. Similarly, when prices are falling, these same round numbers can offer support.

This phenomenon is well illustrated in Maruti’s price chart, where round figures repeatedly acted as support or resistance zones. While the reaction might not happen exactly at the round number, it typically occurs in the nearby range. In the same category fall 52-week highs and lows, which also tend to influence price behavior simply because traders remember the levels more than the reasons that caused them.
When Support and Resistance Fail
Although support and resistance are powerful tools, they are not infallible. Certain market conditions such as global geopolitical tensions, natural disasters, government policy changes, or black swan events like pandemics, can override all technical levels.
In such cases, stock prices may disregard all historical support and resistance levels and chart new territory. Occasionally, stock-specific developments like earnings surprises, major corporate actions, or regulatory changes may also trigger moves that defy expected S/R reactions. These are exceptions and not the rule. They highlight the importance of adapting strategies to market context.