m.Stock by Mirae AssetOpen Demat Account
m.Stock by Mirae Asset
Type
Select Type
Expiry
-
F&O

- PE 

Current value unavailable.
As on - | -

Overview

  • Open-
  • High-
  • Low-
  • Prev. Close-
  • O.I-
  • O.I Change %-
  • Market Lot-
  • Avg. Traded Price-
  • Volume-
  • Spot Price-
  • Rollover Cost-
  • Rollover %-

Chart

  • 1D
  • 1W
  • 1M

Option Chain

CALLS   PUTS
Open Int
(Change)
LTPStrike PriceLTPOpen Int
(Change)
There is no data available for this range

SPOT Pivot Levels

TypeClassicFibonacci
R1 --
R2--
R3--
PP- -
S1--
S2--
S3 --

Index Constituent

Stock NameVolumeOpenHighLowPre. Close
logo of Union Bank of India
Union Bank of India
Current price 186.98 rupees. Up by 3.38 rupees, that is 1.84 percent. 186.98 3.38(1.84%)
1.12Cr182.35187.33181.4183.6
logo of AU Small Finance Bank Ltd
AU Small Finance Bank Ltd
Current price 1,128.6 rupees. Up by 14.6 rupees, that is 1.31 percent. 1128.6 14.6(1.31%)
56.87L11141144.11105.11114
logo of Canara Bank
Canara Bank
Current price 128.81 rupees. Up by 1.51 rupees, that is 1.19 percent. 128.81 1.51(1.19%)
1.48Cr127.23128.81126.25127.3
logo of State Bank of India
State Bank of India
Current price 1,048 rupees. Up by 8.5 rupees, that is 0.82 percent. 1048 8.5(0.82%)
99.73L103610481031.31039.5
logo of ICICI Bank Ltd
ICICI Bank Ltd
Current price 1,422.7 rupees. Up by 7.7 rupees, that is 0.54 percent. 1422.7 7.7(0.54%)
79.74L14081424.914081415
logo of Punjab National Bank
Punjab National Bank
Current price 115.93 rupees. Up by 0.07 rupees, that is 0.06 percent. 115.93 0.07(0.06%)
1.30Cr115.61116.9115.01115.86
logo of Kotak Mahindra Bank Ltd
Kotak Mahindra Bank Ltd
Current price 401.6 rupees. Up by 0.15 rupees, that is 0.04 percent. 401.6 0.15(0.04%)
1.02Cr398.3402.05398.15401.45
logo of Axis Bank Ltd
Axis Bank Ltd
Current price 1,235 rupees. Down by 1 rupees, that is 0.08 percent. 1235 -1(-0.08%)
36.06L1236.11240.51229.81236
logo of HDFC Bank Ltd
HDFC Bank Ltd
Current price 727.5 rupees. Down by 1.5 rupees, that is 0.21 percent. 727.5 -1.5(-0.21%)
1.75Cr726.6728.7722729
logo of Bank of Baroda
Bank of Baroda
Current price 241 rupees. Down by 0.5 rupees, that is 0.21 percent. 241 -0.5(-0.21%)
1.13Cr241.5242.9239.9241.5
logo of IndusInd Bank Ltd
IndusInd Bank Ltd
Current price 1,015 rupees. Down by 3.4 rupees, that is 0.33 percent. 1015 -3.4(-0.33%)
14.27L1014.910221003.61018.4
logo of Yes Bank Ltd
Yes Bank Ltd
Current price 22.5 rupees. Down by 0.1 rupees, that is 0.44 percent. 22.5 -0.1(-0.44%)
6.42Cr22.622.6722.4222.6
logo of IDFC First Bank Ltd
IDFC First Bank Ltd
Current price 85 rupees. Down by 0.89 rupees, that is 1.04 percent. 85 -0.89(-1.04%)
1.17Cr85.9286.178585.89
logo of Federal Bank Ltd
Federal Bank Ltd
Current price 346.95 rupees. Down by 10.8 rupees, that is 3.02 percent. 346.95 -10.8(-3.02%)
1.61Cr357.7358.7342.05357.75

Related articles

How Traders Use Maximum Drawdown to Manage Portfolio Risk?

How Traders Use Maximum Drawdown to Manage Portfolio Risk?

Calendar graphicAugust 19, 2026 | 11 mins read

When evaluating an investment or trading strategy, returns usually receive the most attention. However, returns alone do not tell investors how much risk was taken to achieve them. Two portfolios may deliver the same annual return, but one may have experienced far steeper losses during market downturns. This is where max drawdown becomes useful. It measures the largest decline in the value of a portfolio, trading account, or investment from its highest point to its lowest point before a new peak is reached. Instead of focusing only on profits, it shows the worst historical loss an investor would have experienced by staying invested.

Read More
Iron Butterfly vs Iron Condor: Which Strategy Is Better?

Iron Butterfly vs Iron Condor: Which Strategy Is Better?

Calendar graphicAugust 19, 2026 | 8 mins read

Options trading is not always about predicting the next big market move. At times, the market trades within a narrow range, creating opportunities for strategies that benefit from stability rather than direction. Two of the most widely used neutral strategies are the iron butterfly strategy and the iron condor options strategy. While both strategies use four option contracts and defined risk, they do not behave in the same way. Differences in strike selection, profit range, and risk-reward dynamics can significantly affect trading outcomes. Understanding the difference between an iron condor and an iron butterfly can help you select a strategy that matches your market expectations and trading objectives.

Read More
Iron Condor Strategy

Iron Condor Strategy

Calendar graphicAugust 19, 2026 | 10 mins read

Markets do not always trend strongly. At times, prices remain within a narrow range, making directional trades more challenging. The iron condor strategy is designed for these market conditions. It doesn’t rely on a bullish or bearish outlook. It aims to generate returns when the underlying asset remains within a predefined price range. With clearly defined risk and reward, it has become a widely used approach among traders looking to capitalise on range-bound markets while maintaining controlled exposure.

Read More
expAppScreen

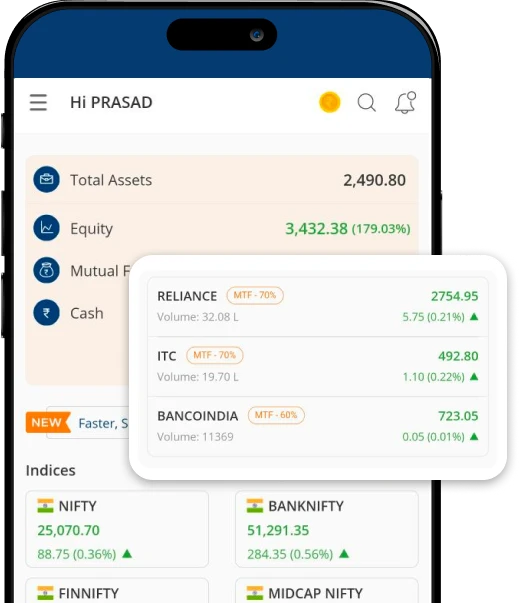
Explore m.Stock AppInstant margin | Real-time charts | Quick order placements

Scan QR Code
QR Code to download the Stock app
OR
Get it on
Download m.stock in Google Play store opens in new tab.Download m.Stock on App Store opens in new tab.