m.Stock by Mirae AssetOpen Demat Account
m.Stock by Mirae Asset
Type
Select Type
Expiry
-
F&O

- PE 

Current value unavailable.
As on - | -

Overview

  • Open-
  • High-
  • Low-
  • Prev. Close-
  • O.I-
  • O.I Change %-
  • Market Lot-
  • Avg. Traded Price-
  • Volume-
  • Spot Price-
  • Rollover Cost-
  • Rollover %-

Chart

  • 1D
  • 1W
  • 1M

Option Chain

CALLS   PUTS
Open Int
(Change)
LTPStrike PriceLTPOpen Int
(Change)
There is no data available for this range

SPOT Pivot Levels

TypeClassicFibonacci
R1 --
R2--
R3--
PP- -
S1--
S2--
S3 --

Index Constituent

Stock NameVolumeOpenHighLowPre. Close
logo of Bharat Forge Ltd
Bharat Forge Ltd
Current price 2,190.5 rupees. Up by 85.8 rupees, that is 4.08 percent. 2190.5 85.8(4.08%)
19.42L21012196.721012104.7
logo of Persistent Systems Ltd
Persistent Systems Ltd
Current price 5,183.9 rupees. Up by 124.6 rupees, that is 2.46 percent. 5183.9 124.6(2.46%)
5.32L5120.95195.750905059.3
logo of Indian Bank
Indian Bank
Current price 832.4 rupees. Up by 12.5 rupees, that is 1.52 percent. 832.4 12.5(1.52%)
27.07L821835.75816819.9
logo of Swiggy Ltd
Swiggy Ltd
Current price 276.87 rupees. Up by 3.91 rupees, that is 1.43 percent. 276.87 3.91(1.43%)
1.82Cr273.89281267.2272.96
logo of IndusInd Bank Ltd
IndusInd Bank Ltd
Current price 1,027.2 rupees. Up by 13.7 rupees, that is 1.35 percent. 1027.2 13.7(1.35%)
22.58L1013.81031.210101013.5
logo of PB Fintech Ltd
PB Fintech Ltd
Current price 1,574 rupees. Up by 12.9 rupees, that is 0.83 percent. 1574 12.9(0.83%)
21.36L1567.116101567.11561.1
logo of Marico Ltd
Marico Ltd
Current price 844 rupees. Up by 4.65 rupees, that is 0.55 percent. 844 4.65(0.55%)
20.40L840852.95829.9839.35
logo of Hindustan Petroleum Corporation Ltd
Hindustan Petroleum Corporation Ltd
Current price 400.4 rupees. Up by 1 rupees, that is 0.25 percent. 400.4 1(0.25%)
59.51L401403.35396.6399.4
logo of Hero MotoCorp Ltd
Hero MotoCorp Ltd
Current price 4,909.9 rupees. Up by 11.9 rupees, that is 0.24 percent. 4909.9 11.9(0.24%)
4.34L490049254870.94898
logo of Ashok Leyland Ltd
Ashok Leyland Ltd
Current price 155.23 rupees. Up by 0.36 rupees, that is 0.23 percent. 155.23 0.36(0.23%)
1.01Cr155156.08154.3154.87
logo of Suzlon Energy Ltd
Suzlon Energy Ltd
Current price 51.99 rupees. Up by 0.02 rupees, that is 0.04 percent. 51.99 0.02(0.04%)
11.14Cr51.9652.2951.2751.97
logo of AU Small Finance Bank Ltd
AU Small Finance Bank Ltd
Current price 1,030.2 rupees. Down by 4.9 rupees, that is 0.47 percent. 1030.2 -4.9(-0.47%)
7.49L1035.110371018.31035.1
logo of SRF Ltd
SRF Ltd
Current price 2,874.7 rupees. Down by 14.6 rupees, that is 0.51 percent. 2874.7 -14.6(-0.51%)
2.33L2899.22914.928532889.3
logo of Indus Towers Ltd
Indus Towers Ltd
Current price 403.5 rupees. Down by 2.15 rupees, that is 0.53 percent. 403.5 -2.15(-0.53%)
47.88L407408401.75405.65
logo of Yes Bank Ltd
Yes Bank Ltd
Current price 23.61 rupees. Down by 0.14 rupees, that is 0.59 percent. 23.61 -0.14(-0.59%)
7.55Cr23.7523.7523.2123.75
logo of One 97 Communications Ltd
One 97 Communications Ltd
Current price 1,348 rupees. Down by 13.1 rupees, that is 0.96 percent. 1348 -13.1(-0.96%)
20.71L13601365.31325.41361.1
logo of Aurobindo Pharma Ltd
Aurobindo Pharma Ltd
Current price 1,533.4 rupees. Down by 15 rupees, that is 0.97 percent. 1533.4 -15(-0.97%)
5.18L155015501520.41548.4
logo of Fortis Healthcare Ltd
Fortis Healthcare Ltd
Current price 952.45 rupees. Down by 10.65 rupees, that is 1.11 percent. 952.45 -10.65(-1.11%)
6.05L963.1964944963.1
logo of Life Insurance Corporation of India
Life Insurance Corporation of India
Current price 433.1 rupees. Down by 5.2 rupees, that is 1.19 percent. 433.1 -5.2(-1.19%)
59.66L438447.6432.2438.3
logo of Dixon Technologies (India) Ltd
Dixon Technologies (India) Ltd
Current price 14,329 rupees. Down by 178 rupees, that is 1.23 percent. 14329 -178(-1.23%)
6.74L14499145801419214507
logo of Info Edge (India) Ltd
Info Edge (India) Ltd
Current price 1,187.25 rupees. Down by 19.75 rupees, that is 1.64 percent. 1187.25 -19.75(-1.64%)
16.69L1213.31220.51182.051207
logo of Lupin Ltd
Lupin Ltd
Current price 2,443.2 rupees. Down by 57.3 rupees, that is 2.29 percent. 2443.2 -57.3(-2.29%)
6.78L2480.72489.624282500.5
logo of BSE Ltd
BSE Ltd
Current price 3,581.8 rupees. Down by 103.2 rupees, that is 2.8 percent. 3581.8 -103.2(-2.8%)
36.61L368536883571.53685
logo of Bharat Heavy Electricals Ltd
Bharat Heavy Electricals Ltd
Current price 422 rupees. Down by 13.4 rupees, that is 3.08 percent. 422 -13.4(-3.08%)
4.82Cr445446.5420.3435.4
logo of Polycab India Ltd
Polycab India Ltd
Current price 8,862 rupees. Down by 353 rupees, that is 3.83 percent. 8862 -353(-3.83%)
7.27L9169.5917088269215

Related articles

Difference Between Sensex and Nifty Explained

Difference Between Sensex and Nifty Explained

Calendar graphicJuly 10, 2026 | 8 mins read

In the Indian equity market, a broad view of performance is usually captured through two key indices: BSE Sensex and NIFTY 50. Both are widely followed and often referenced as indicators of market direction, but they are not identical in structure or interpretation. Each index is designed to represent a segment of the market, using its own selection criteria. 

Read More
Auto Sector Results 2026: Stability or Volatility Ahead?

Auto Sector Results 2026: Stability or Volatility Ahead?

Calendar graphicJuly 10, 2026 | 7 mins read

The Indian automobile industry has entered FY27 with strong momentum, supported by resilient demand, policy support, and structural shifts like electrification. However, as you assess auto sector stocks, you will notice that growth is not uniform. The sector reflects both stability in domestic demand and volatility arising from global headwinds. Understanding these dynamics is essential if you want to interpret automotive sector trends and make informed investment decisions. This blog will guide you in exploring the important aspects of the auto sector, such as sector overview, demand, and other important factors.

Read More
Capital Goods Sector in 2026: What is Driving Stronger Performance

Capital Goods Sector in 2026: What is Driving Stronger Performance

Calendar graphicJuly 10, 2026 | 7 mins read

If you have been tracking markets closely, you have likely noticed how the capital goods sector has moved from being cyclical and uncertain to one of the strongest performers in recent years. As you step into 2026, this momentum is not accidental. It is backed by structural shifts in policy, investment, and demand. In simple terms, when a country builds more roads, factories, railways, and power plants, capital goods companies sit right at the centre of that growth. And right now, India is building aggressively. This blog breaks down what is driving this shift, how the capex cycle in India is evolving, and what it means for the sector’s outlook in the coming years.

Read More
expAppScreen

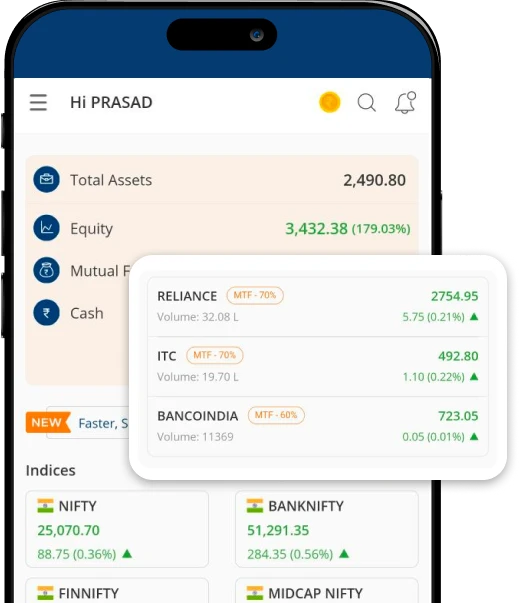
Explore m.Stock AppInstant margin | Real-time charts | Quick order placements

Scan QR Code
QR Code to download the Stock app
OR
Get it on
Download m.stock in Google Play store opens in new tab.Download m.Stock on App Store opens in new tab.